The LoRa Uplink Analysis Dashboard in Kudzu Analytics provides detailed insights into the uplink communication performance of a LoRaWAN network. It allows users to monitor key metrics and identify potential issues that may affect network quality.
Dashboard Overview
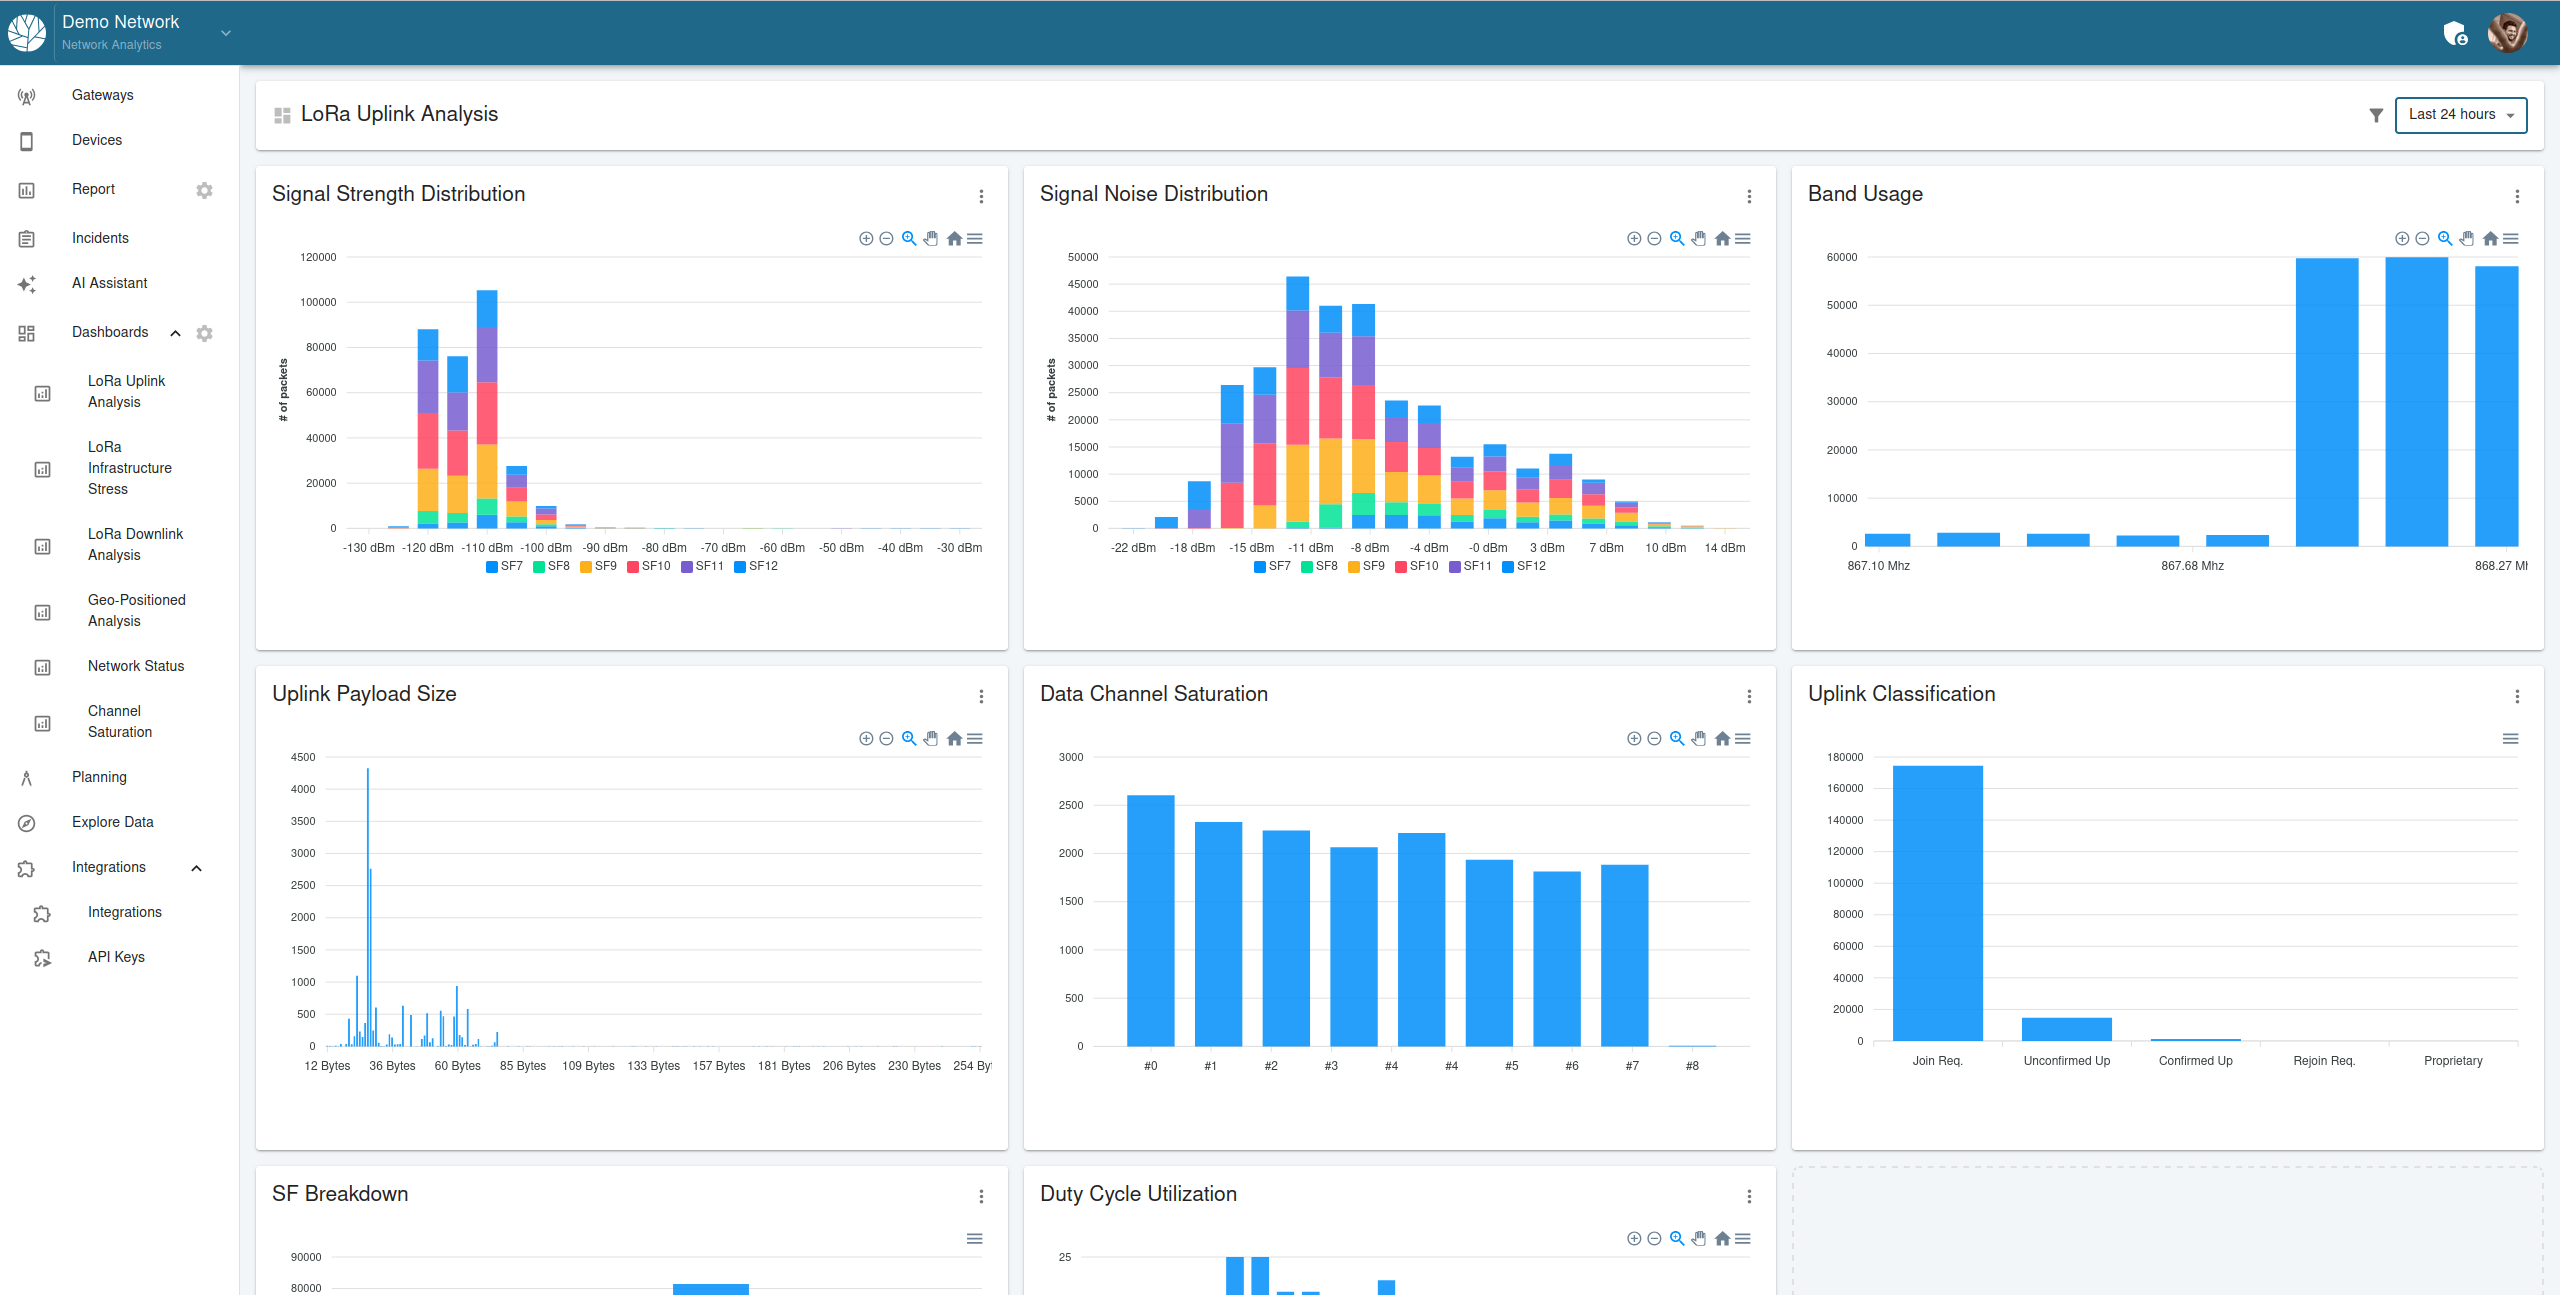
The dashboard consists of the following visualizations:
Signal Strength Distribution:
- Displays the distribution of received signal strength (RSSI) across different spreading factors (SF).
- Helps identify areas with poor signal reception or imbalances in SF utilization.
Signal Noise Distribution:
- Shows the noise levels in the network, segmented by spreading factors.
- Assists in understanding interference patterns and their impact on communication.
Uplink Payload Size:
- Highlights the distribution of uplink payload sizes.
- Useful for analyzing device traffic and application-level trends.
Data Channel Saturation:
- Monitors the usage of available data channels.
- Helps ensure efficient spectrum utilization and avoid bottlenecks.
Duty Cycle Utilization:
- Tracks the duty cycle usage for compliance with regional regulations.
- Alerts users to potential violations that could impact network operation.
Uplink Classification:
- Categorizes uplink traffic into types such as join requests, confirmed uplinks, and unconfirmed uplinks.
- Provides insights into the nature of device communication in the network.
Band Usage:
- Visualizes the frequency bands being utilized within the network.
- Identifies potential band congestion or underutilization.
Interactive Features
The LoRa Uplink Analysis Dashboard includes several interactive features to enhance the user experience:
Data Filtering:
- Users can filter data by time, selecting from predefined options (e.g., Last 24 Hours, Last Week) or custom date ranges.
- Gateway-specific filters allow users to analyze data from selected gateways.
Drill-Down Capabilities:
- Clicking on a visualization element provides more detailed information, enabling users to explore specific metrics or events.
Customizable Views:
- Users can rearrange or resize visualizations to focus on the most relevant metrics for their use case.
Use Case Example
Scenario:
A network operator notices an increase in failed join requests from devices in a specific region. Using the LoRa Uplink Analysis Dashboard:
Analyze Signal Strength:
- Check the Signal Strength Distribution to identify areas with weak signals.
Investigate Noise Levels:
- Use the Signal Noise Distribution to determine if interference is causing the issue.
Monitor Uplink Traffic:
- Examine the Uplink Classification and Duty Cycle Utilization to assess device behavior and regulatory compliance.
By leveraging these insights, the operator can take corrective actions such as adjusting gateway placement or optimizing device configurations.
The LoRa Uplink Analysis Dashboard is a vital tool for ensuring reliable and efficient network operations in LoRaWAN deployments.