The LoRa Infrastructure Stress Dashboard in Kudzu Analytics provides insights into the operational load and redundancy of a LoRaWAN network. This dashboard helps users understand how the network is handling traffic and whether critical aspects like redundancy and join operations are functioning optimally.
Dashboard Overview
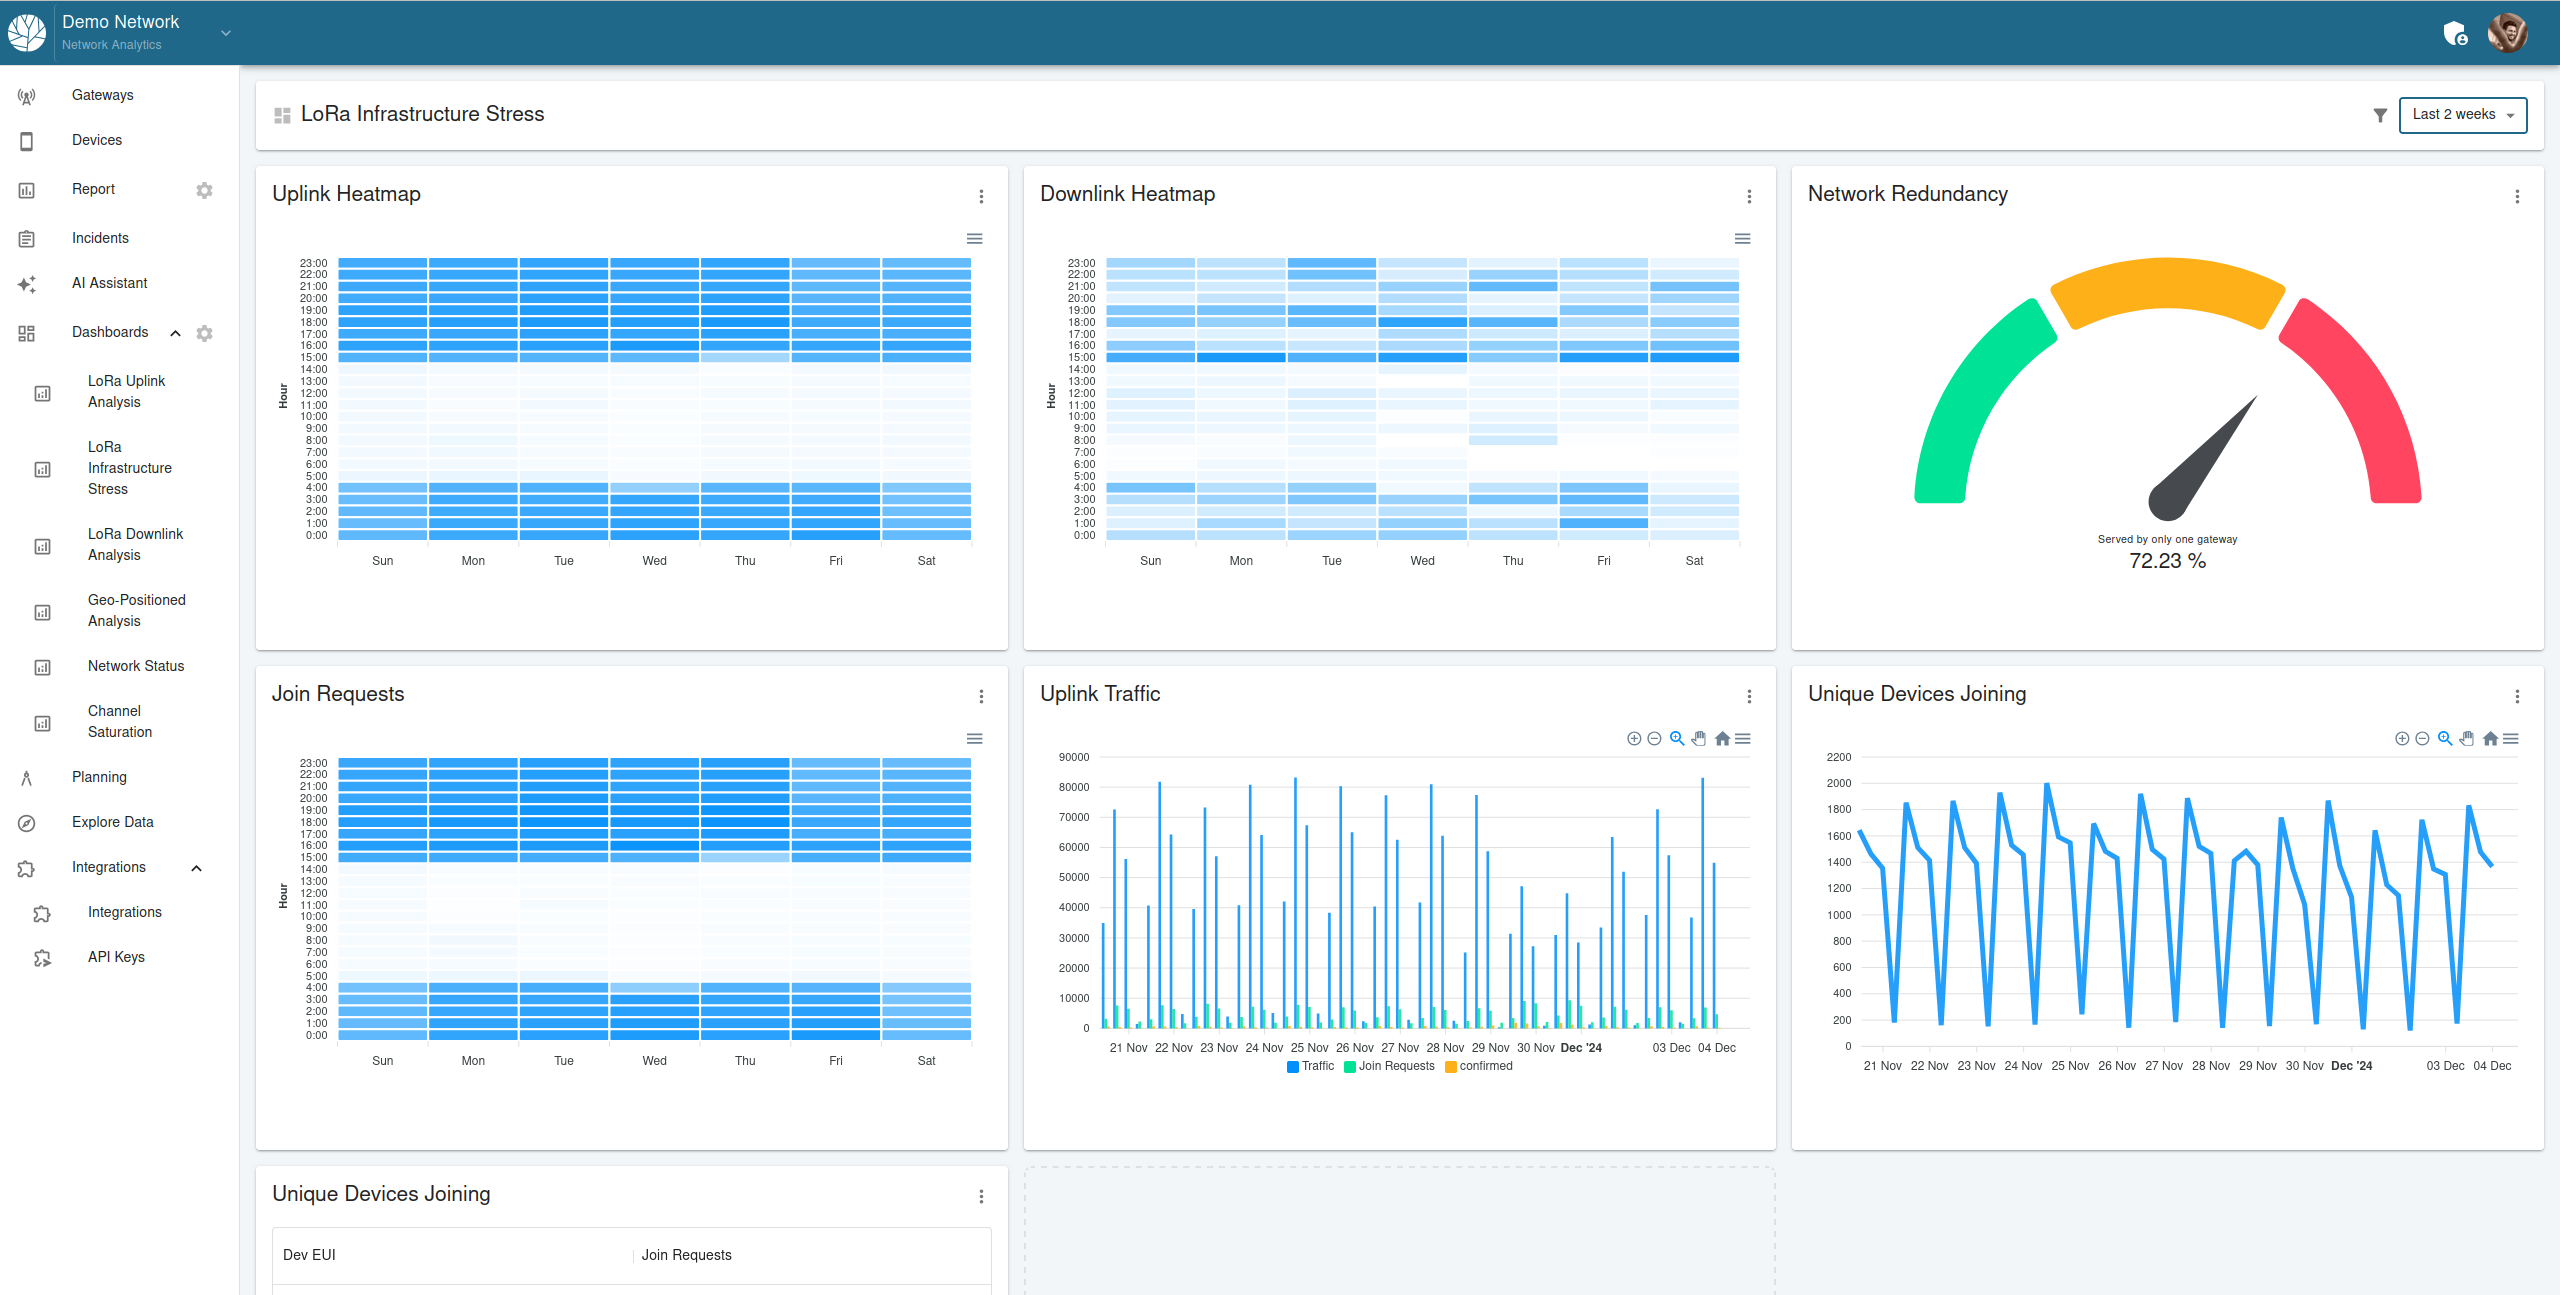
The dashboard consists of the following visualizations:
Uplink Heatmap:
- Visualizes uplink activity over time, segmented by hour and day.
- Identifies periods of high network activity that may stress the infrastructure.
Downlink Heatmap:
- Displays downlink activity patterns, segmented similarly to uplink data.
- Useful for understanding device communication requirements and response times.
Network Redundancy:
- A gauge visualization showing the percentage of devices served by more than one gateway.
- Highlights areas where redundancy may be lacking, indicating potential vulnerabilities in the network.
Join Requests:
- Shows the frequency and timing of join requests.
- Useful for detecting spikes or trends in device onboarding.
Uplink Traffic:
- Tracks the total uplink traffic and its breakdown (e.g., confirmed vs. unconfirmed messages).
- Provides a high-level view of overall network utilization.
Unique Devices Joining:
- Monitors the number of unique devices attempting to join the network over time.
- Identifies trends in network usage and onboarding rates.
Interactive Features
The LoRa Infrastructure Stress Dashboard includes interactive features that enable users to:
Filter Data:
- Apply time-based filters (e.g., Last Week, Last Month) to focus on specific periods.
- Narrow down data by selecting specific gateways or regions.
Zoom and Drill Down:
- Explore detailed metrics by zooming into specific heatmap segments or traffic patterns.
Customize Layouts:
- Rearrange or resize visualizations to focus on the most relevant data for the current analysis.
Use Case Example
Scenario:
A network operator observes increased packet loss during peak hours in a city-wide deployment. Using the LoRa Infrastructure Stress Dashboard:
Review Heatmaps:
- Examine the Uplink Heatmap to identify hours with the highest traffic.
- Check the Downlink Heatmap for corresponding patterns of gateway responses.
Analyze Redundancy:
- Use the Network Redundancy gauge to ensure critical devices are served by multiple gateways.
Monitor Join Requests:
- Inspect the Join Requests chart for any unusual spikes, indicating potential device reboots or misconfigurations.
With these insights, the operator can take targeted actions, such as scaling gateway capacity, rebalancing device configurations, or deploying additional gateways in high-traffic areas.
The LoRa Infrastructure Stress Dashboard empowers users to proactively address network issues, ensuring a robust and reliable LoRaWAN deployment.