The LoRa Downlink Analysis Dashboard in Kudzu Analytics provides a comprehensive overview of downlink communication in a LoRaWAN network. This dashboard helps users evaluate the efficiency and patterns of downlink messages, ensuring the network meets performance expectations.
Dashboard Overview
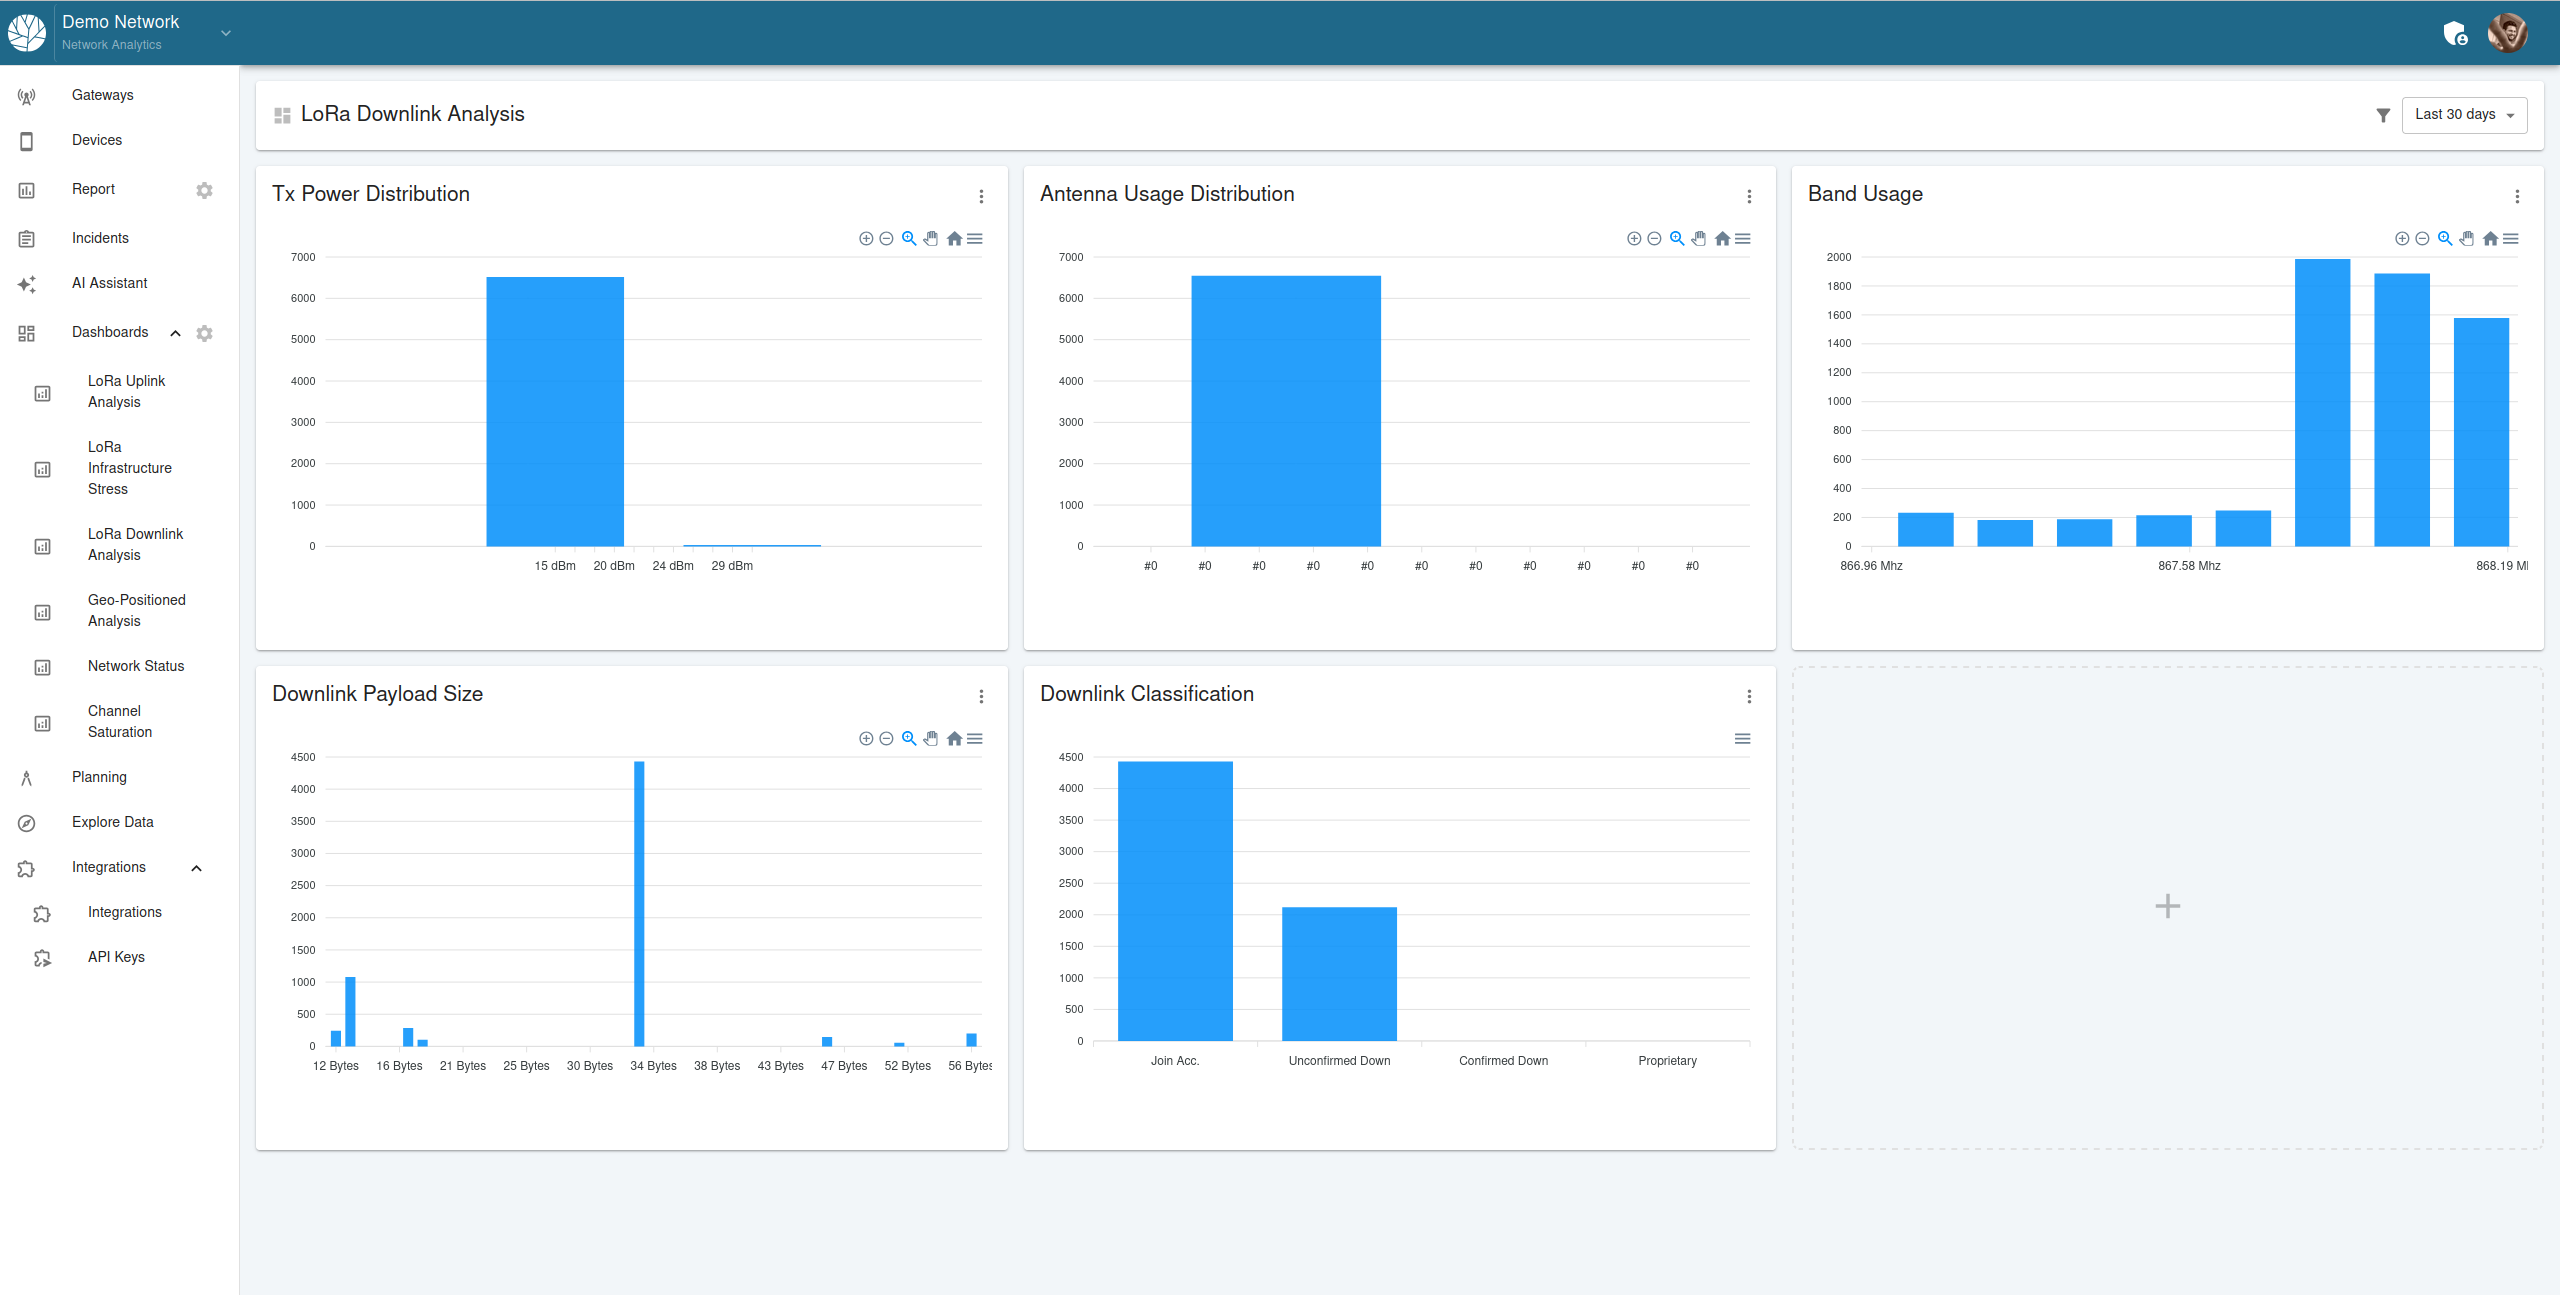
The dashboard includes the following visualizations:
Tx Power Distribution:
- Displays the transmission power levels used by gateways for downlink messages.
- Helps assess whether downlink power levels are appropriate for maintaining reliable communication without excessive power usage.
Antenna Usage Distribution:
- Highlights the distribution of downlink messages across different antennas.
- Useful for identifying imbalances in antenna usage or potential underutilization.
Band Usage:
- Visualizes the frequency bands utilized for downlink communication.
- Helps detect potential congestion or overuse in specific bands.
Downlink Payload Size:
- Shows the distribution of payload sizes in downlink messages.
- Assists in understanding the nature and size of data being transmitted to devices.
Downlink Classification:
- Categorizes downlink messages into types such as join accept, confirmed down, and unconfirmed down.
- Provides insights into the purpose and frequency of downlink traffic.
Interactive Features
The LoRa Downlink Analysis Dashboard offers interactive features to enhance analysis:
Time-Based Filtering:
- Users can filter data by time intervals, such as the last 24 hours, last week, or a custom date range.
Drill-Down and Exploration:
- Clicking on any visualization element provides detailed metrics and insights for further investigation.
Customizable Layout:
- Visualizations can be rearranged or resized to focus on specific aspects of downlink performance.
Use Case Example
Scenario:
A network administrator is troubleshooting delayed responses to device uplink messages in a rural deployment. Using the LoRa Downlink Analysis Dashboard:
Analyze Tx Power:
- Check the Tx Power Distribution to identify whether gateways are transmitting at appropriate power levels.
Review Band Usage:
- Inspect the Band Usage chart to detect potential frequency congestion.
Examine Payload Sizes:
- Use the Downlink Payload Size visualization to determine if large payloads are causing delays.
By leveraging these insights, the administrator can optimize gateway configurations, reassign frequency bands, or adjust payload sizes to improve response times.
The LoRa Downlink Analysis Dashboard ensures efficient and balanced downlink communication, enabling seamless operation in LoRaWAN networks.