Dashboard Functionality Overview
Dashboards in Kudzu Analytics serve as a powerful tool for visualizing and analyzing network performance data. Users can filter and customize their view to gain actionable insights into various aspects of their network’s operation.
Key Features of a Dashboard
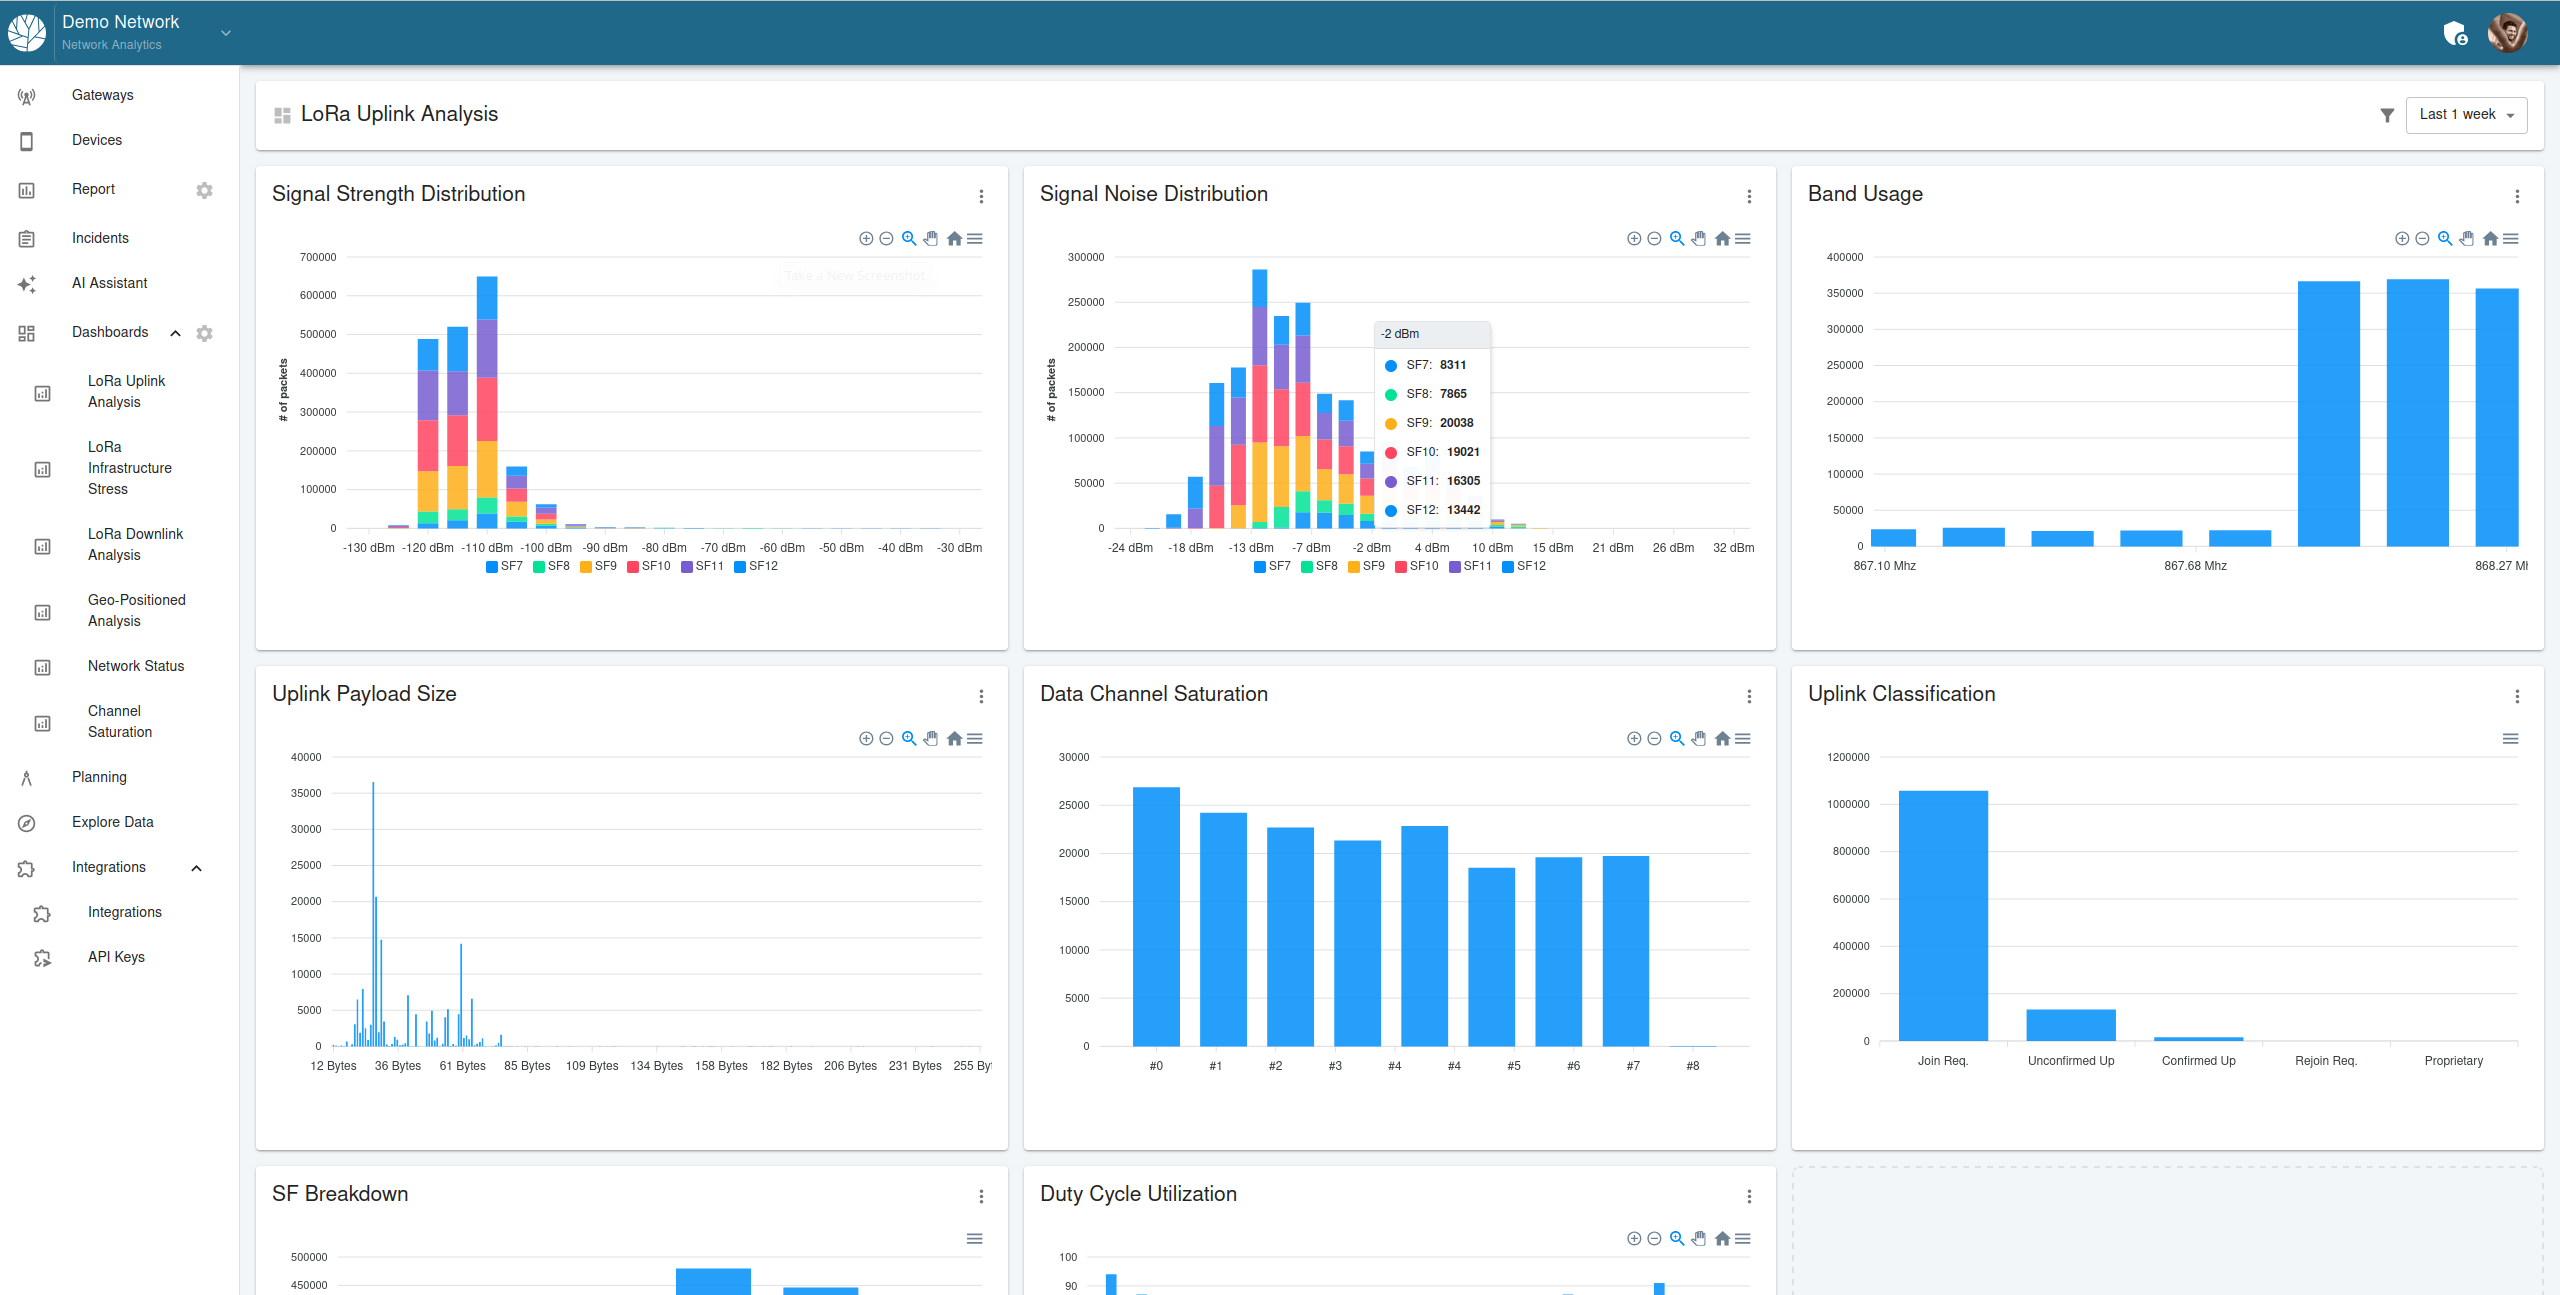
Dashboards provide a high-level overview of key metrics, including:
- Signal Strength Distribution: Displays the distribution of signal strength across different spreading factors (SF).
- Signal Noise Distribution: Visualizes noise levels across the network.
- Uplink Payload Size: Highlights payload size trends.
- Data Channel Saturation: Monitors the utilization of data channels.
- Duty Cycle Utilization: Tracks duty cycle usage to ensure compliance.
- Uplink Classification: Categorizes uplink traffic, such as join requests, confirmed uplinks, and more.
- Band Usage: Shows the frequency bands being utilized in the network.
These metrics help users monitor network health and identify potential issues.
Filtering Dashboard Data
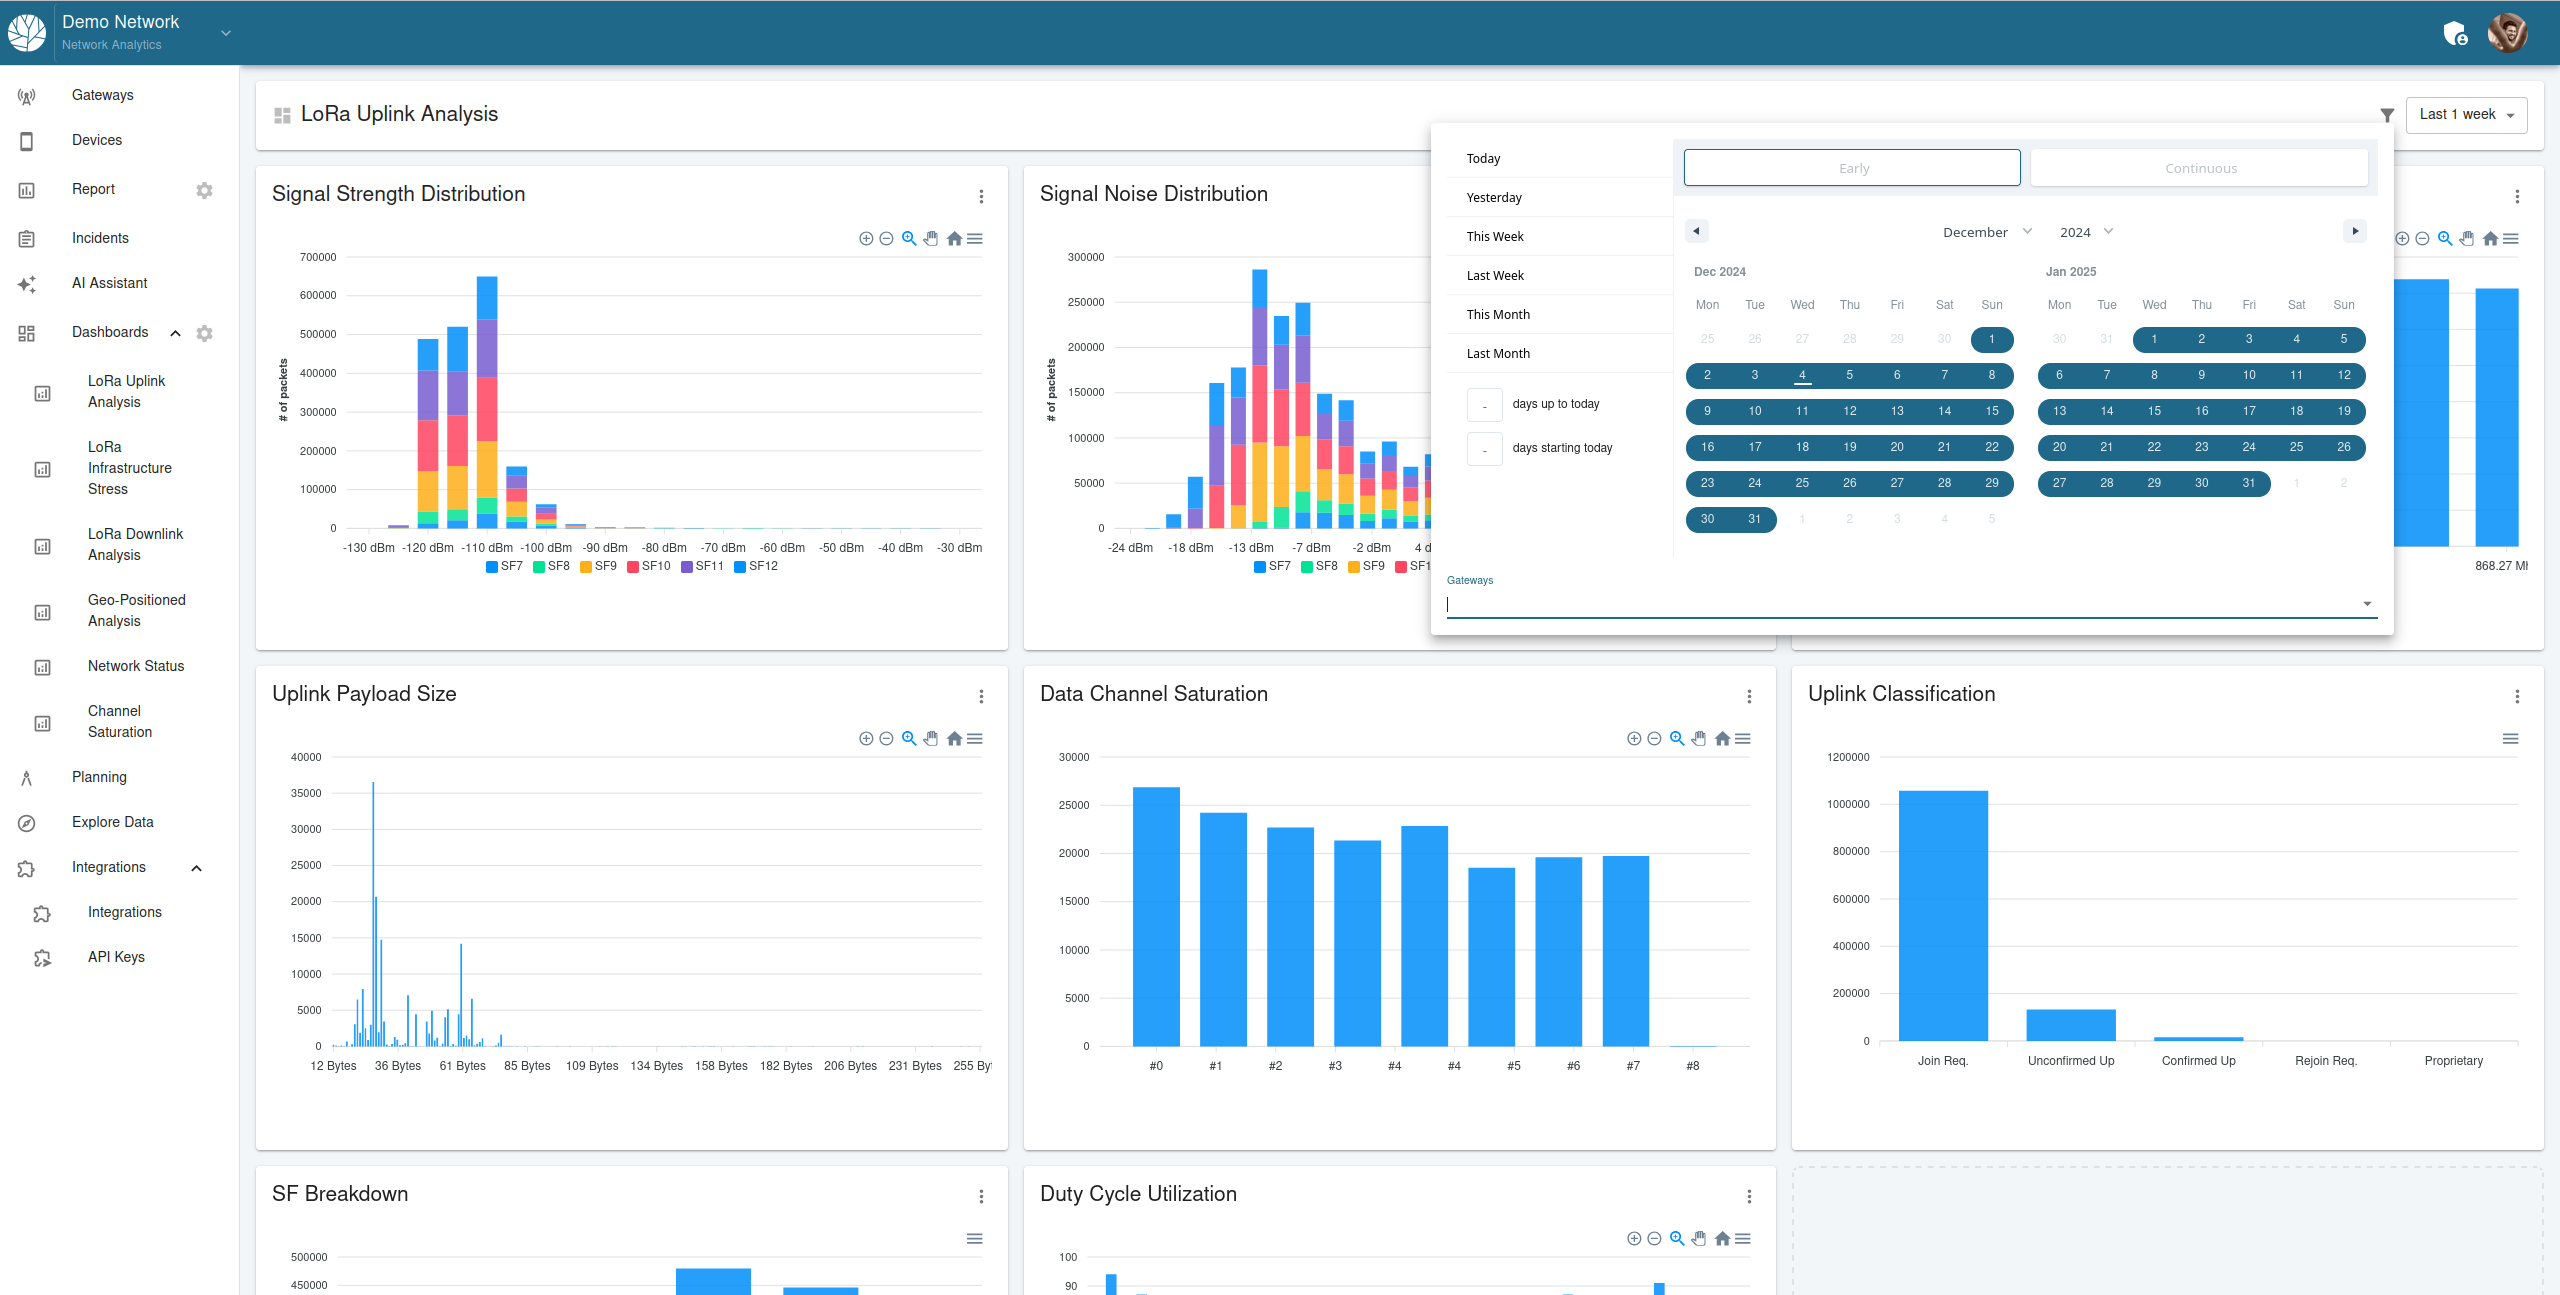
Filtering is a core functionality of dashboards that allows users to:
Filter by Time:
- Select predefined time periods (e.g., Today, Yesterday, Last Week).
- Use custom date ranges for precise filtering.
Filter by Gateways:
- Select specific gateways to narrow down the data to relevant devices.
- Combine time and gateway filters for granular analysis.
Example of Filtering
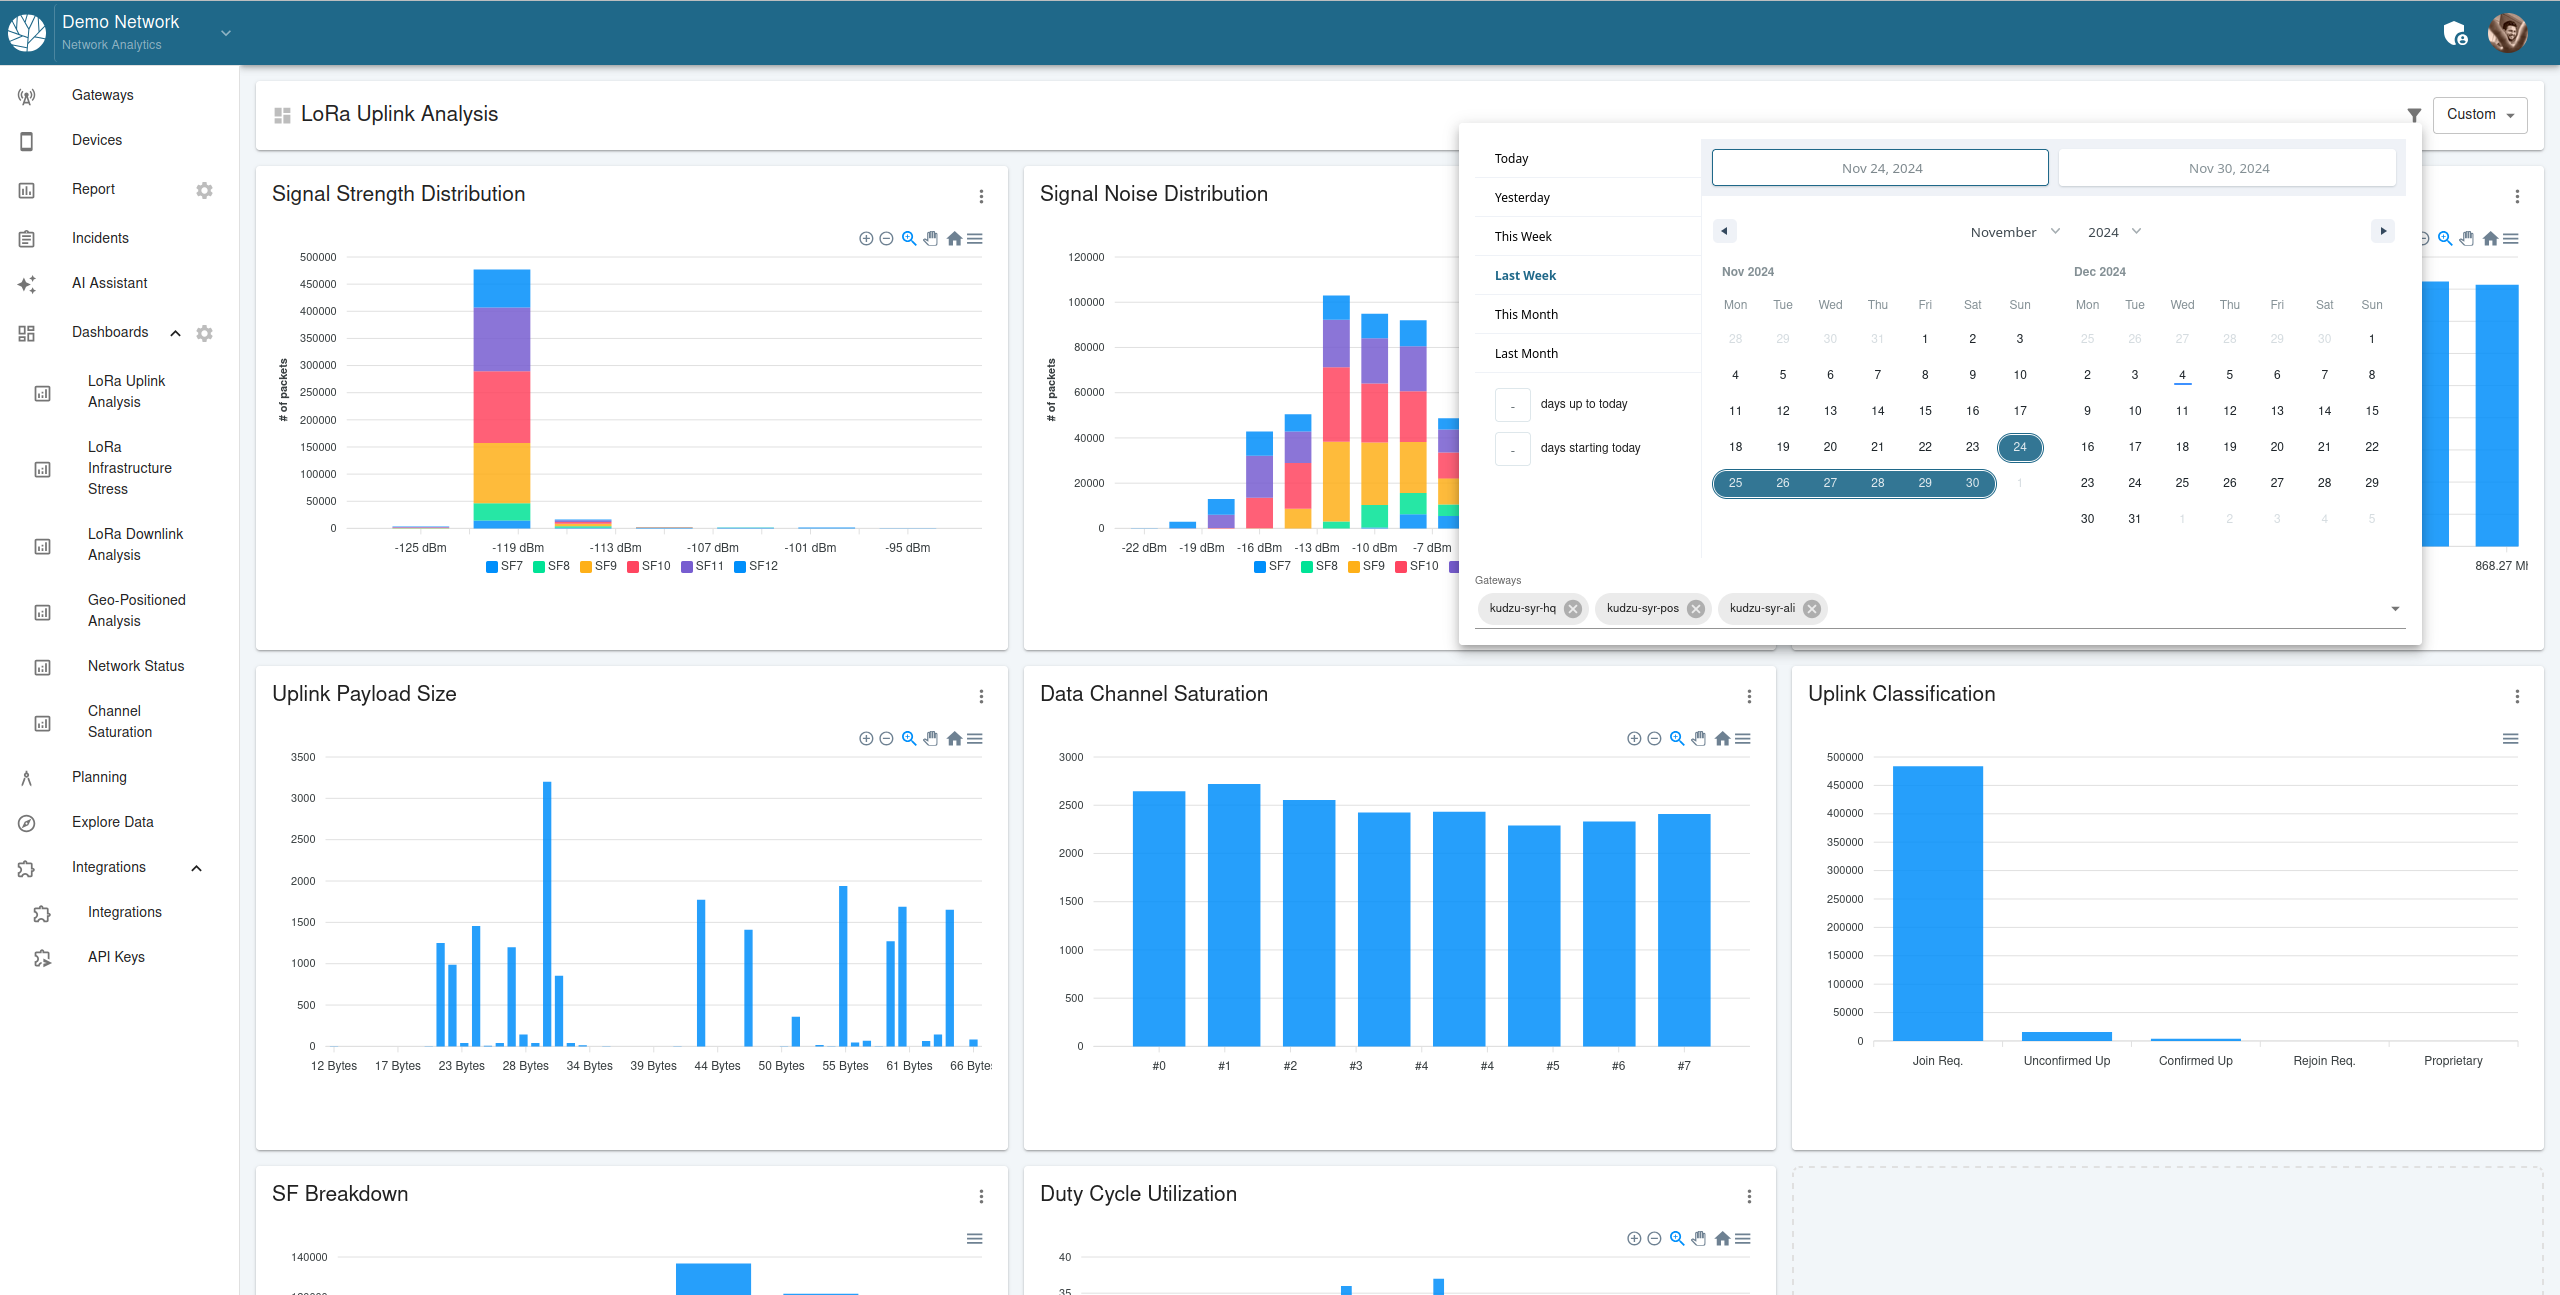
In this example:
- The user filters data for a custom time range (November 24 to November 30).
- Data is further refined by selecting three specific gateways.
This combination provides focused insights, helping users identify patterns or issues related to specific gateways within the chosen timeframe.
By leveraging dashboards and filters, Kudzu Analytics enables users to effectively monitor and optimize their networks.