Deployment
The Deployment view is a map-centered interface used by the deployment team and field operations to track network installation progress. It compares planned RF coverage and gateway locations against actual installations, and provides tools for marking deployment stages per cell until the network is fully operational.

Key areas#
- Map canvas — a full-screen interactive map displaying planned and actual infrastructure overlaid on geographic data.
- Preset selector — a dropdown in the top-right corner with three preset layer combinations.
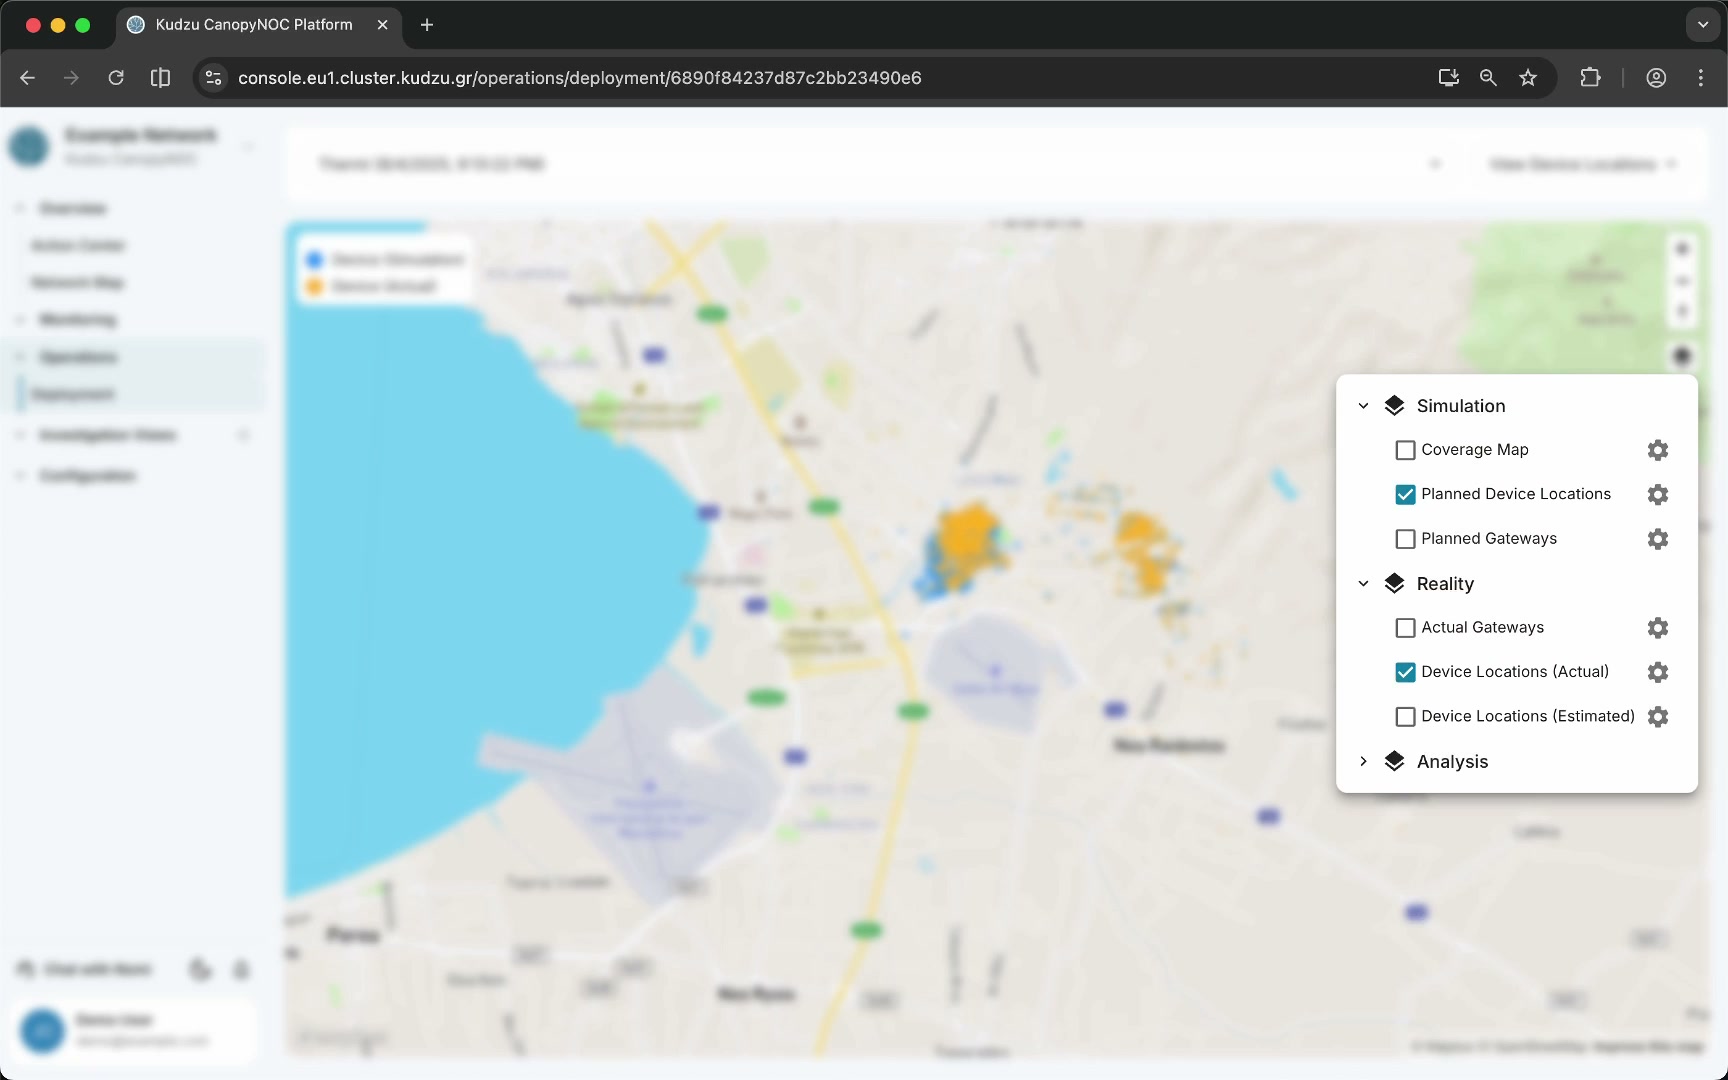
- Layers button — opens a panel for fine-grained control over individual map layers.
- Hexagonal deployment cells — color-coded tiles showing deployment progress per area.
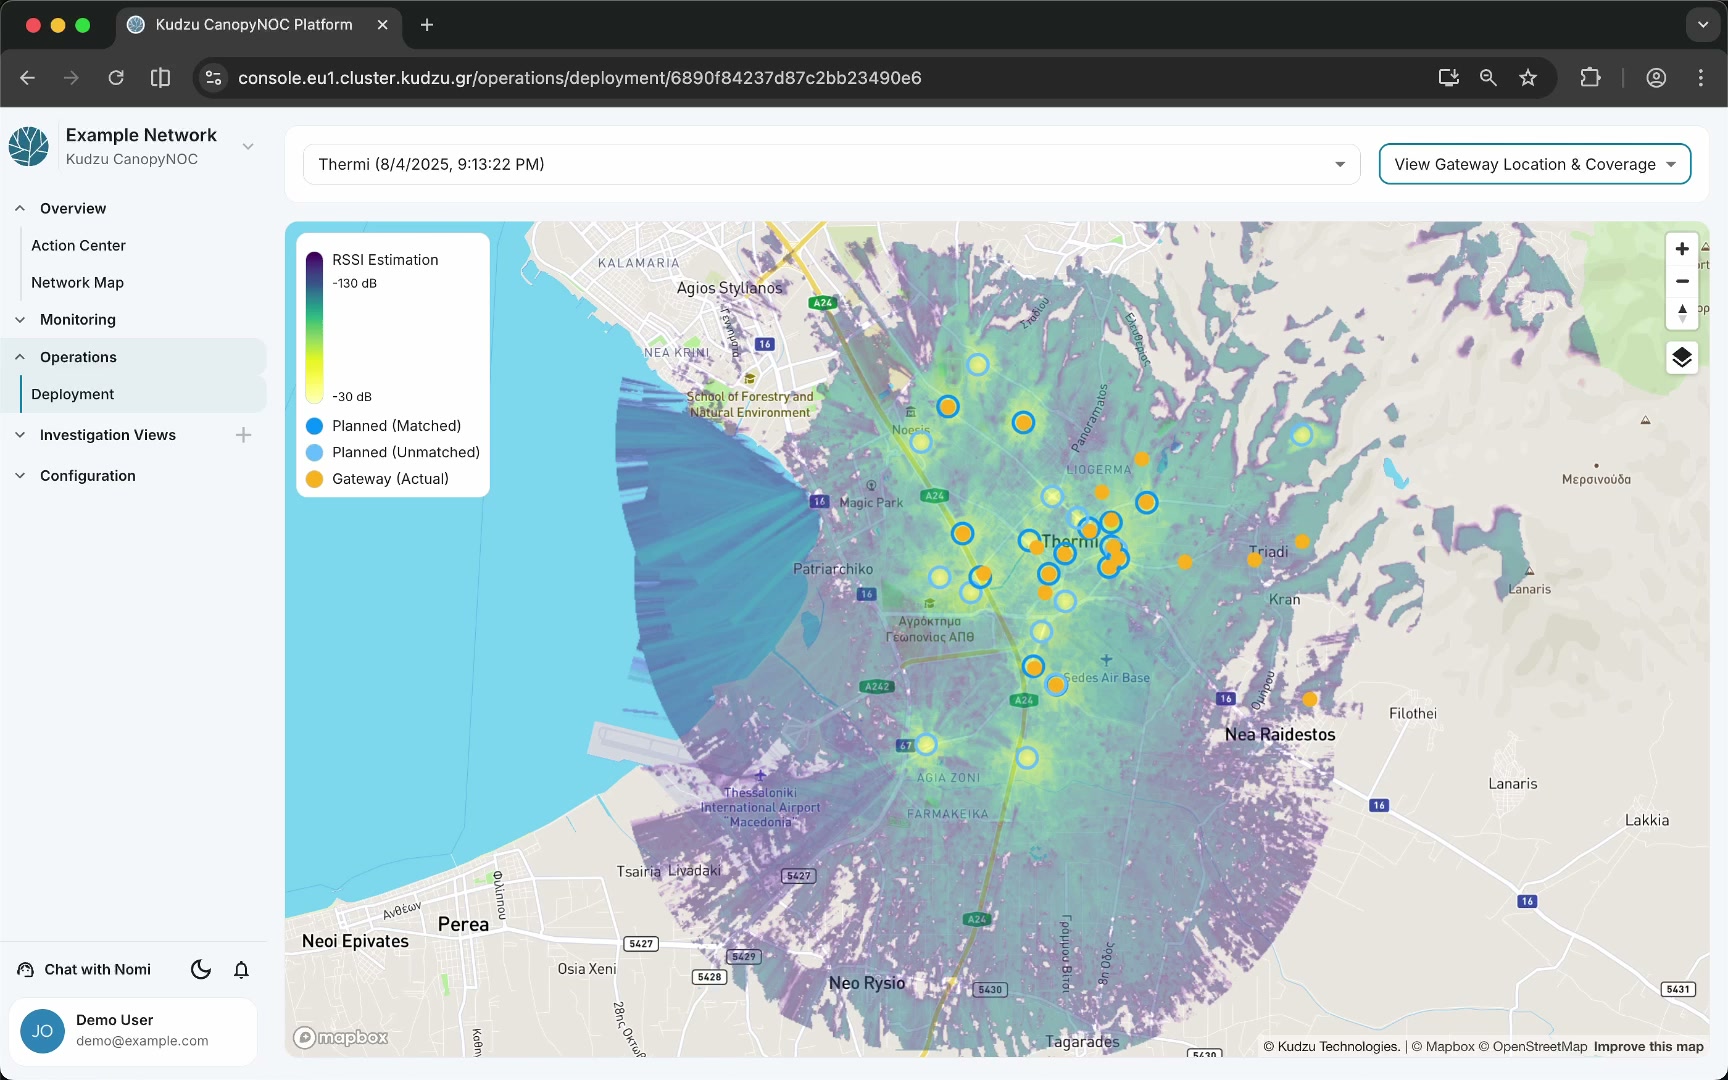
- Gateway markers — blue rings indicating planned gateway locations, with color variation showing installation status.
How to use this view#
Select a preset view#
Use the preset dropdown in the top-right corner to choose the view appropriate for your task:
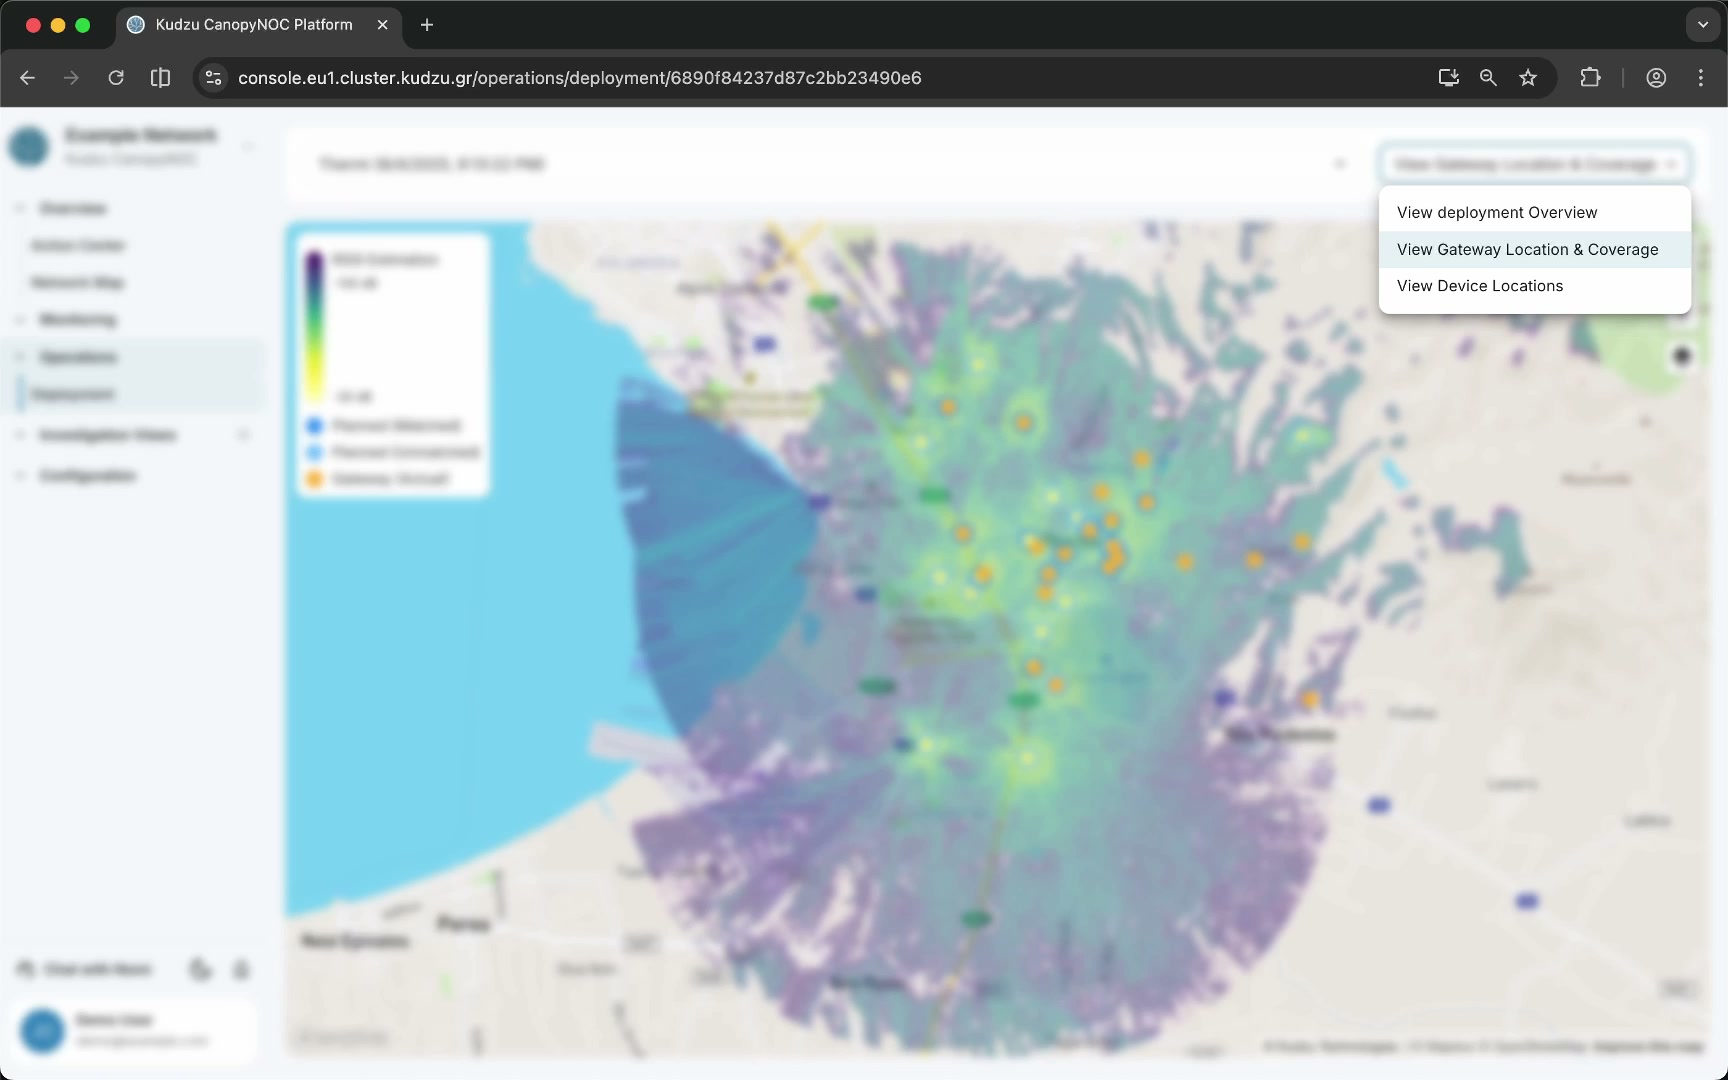
- View Deployment Overview — shows hexagonal cells colored red, blue, or green to indicate overall deployment progress per area.
- View Gateway Location and Coverage — shows the simulated RF quality map as a background layer with planned gateway locations rendered as blue rings.
- View Device Locations — shows planned and observed device positions on the map.
Track deployment progress#
Select View Deployment Overview to see hexagonal tiles indicating the status of each deployment area:
| Color | Status | Description |
|---|---|---|
| Green | Fully deployed | All expected gateways are installed and matched |
| Blue | In progress | Partially deployed or installation underway |
| Red | Not matched | Gateways are missing or not correctly placed |
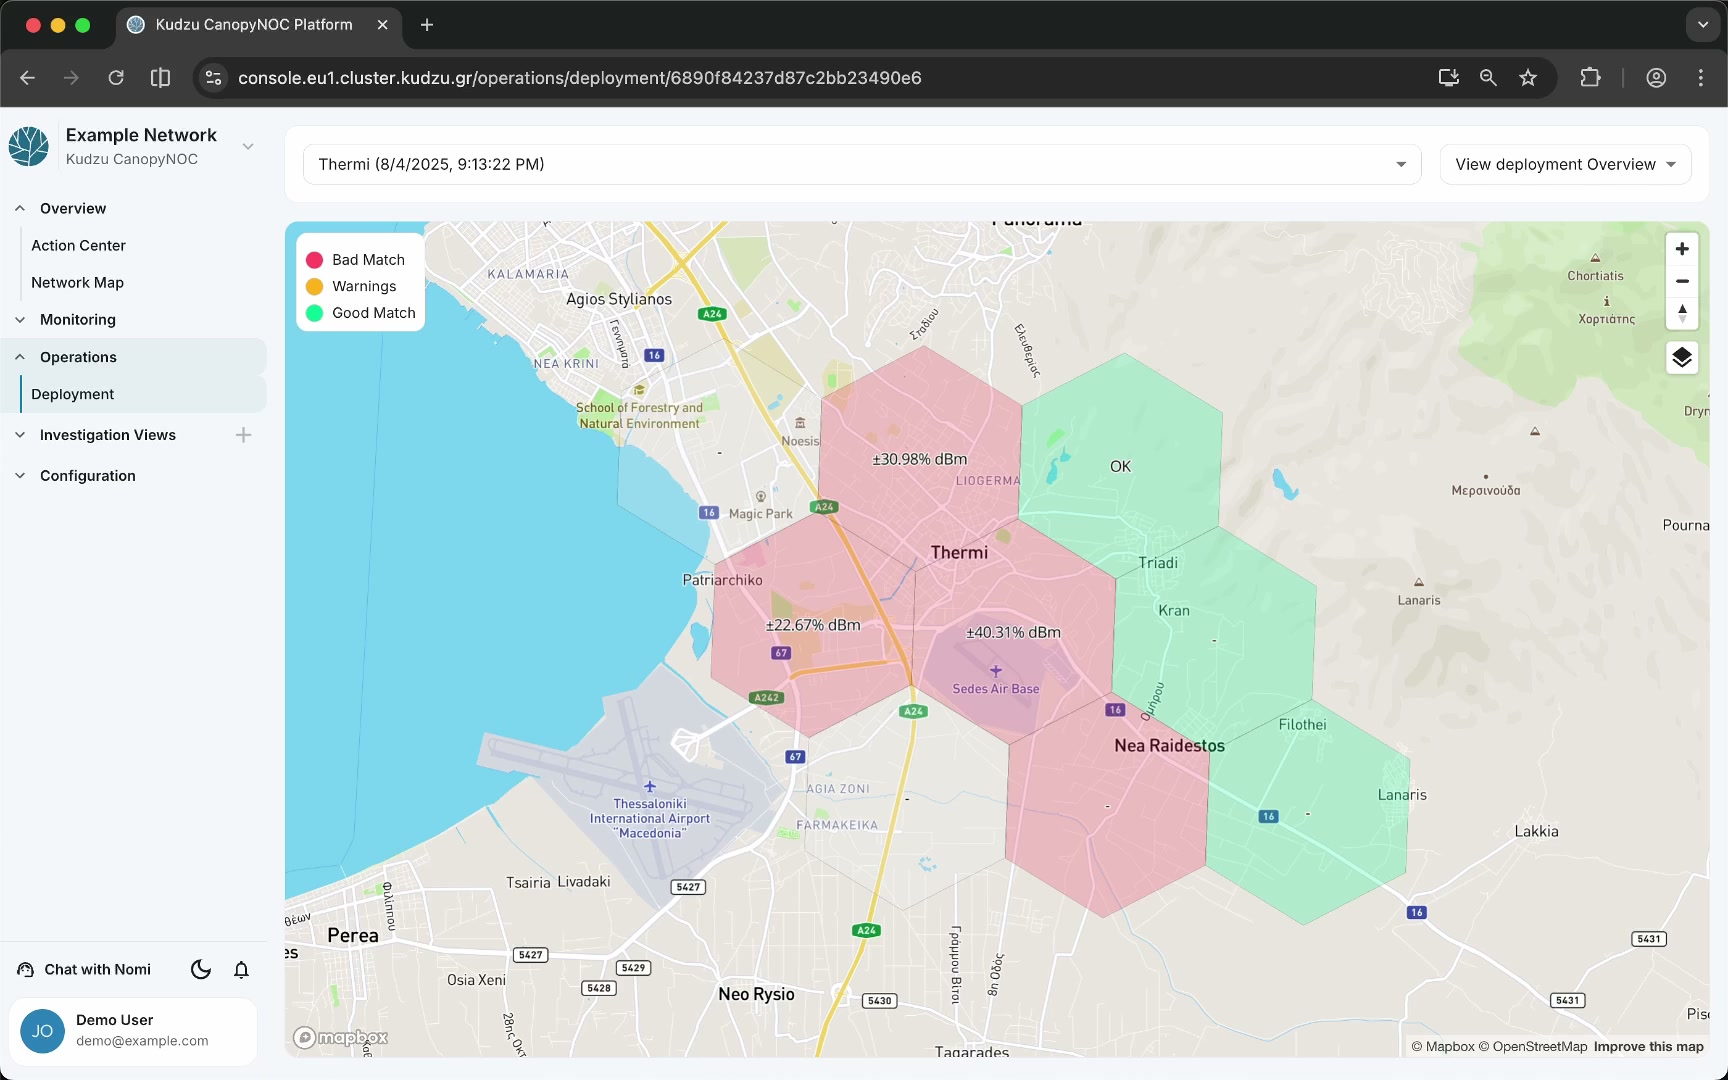
The goal is for all cells to turn green, indicating the full deployment is complete.
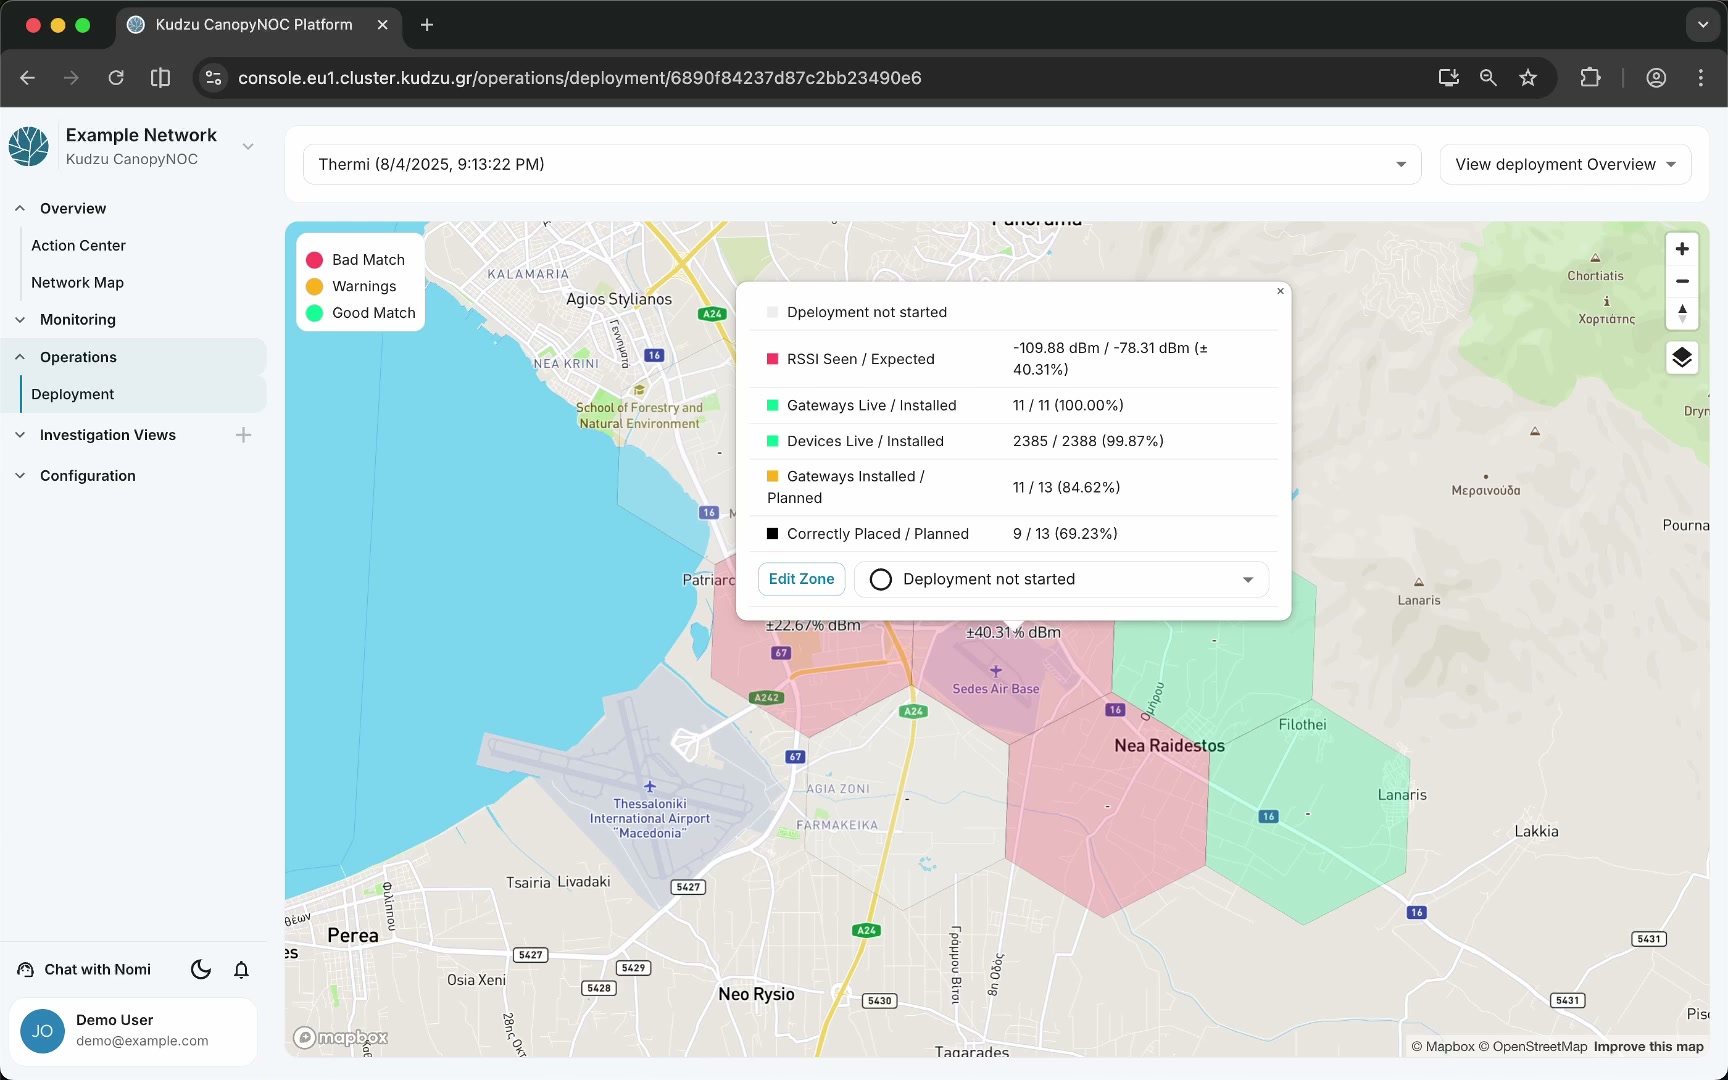
Update cell deployment status#
Click a hexagon cell to open a detail popup where you can:
- View the current deployment status for that cell
- Mark the cell with a stage: deployment in progress, completed, ignored, or not started
- Add notes useful to the network operator
Verify gateway installations#
Select View Gateway Location and Coverage to see planned gateway locations as blue rings:
- Dark blue ring — the platform matched an actual gateway installation at this planned location. The gateway is deployed.
- Light blue ring — the planned location has no matched actual gateway. Installation is still pending.
Control individual layers#
Click the layers button to open a panel listing all available map layers. You can independently toggle:
- Coverage map (simulated RF quality)
- Planned device locations and planned gateways
- Actual gateways and device locations
- Deployment validation at coarse and fine resolution
- RSSI map at two different resolutions
- RF path shadowing
Inspect RF path shadowing#
An advanced layer called RF path shadowing displays a monochrome heat map indicating locations experiencing high RF absorption. Darker tiles represent worse RF shadowing, typically caused by buildings or unexpected construction.

The RF path shadowing layer is useful for investigating signal obstructions but is not required for standard deployment tracking.