Monitoring KPIs
The Monitoring KPIs page controls which analysis algorithms run on your network. This is the administrative counterpart to the Metrics Dashboard — while the dashboard displays computed metrics, this configuration page manages which algorithms produce those metrics.
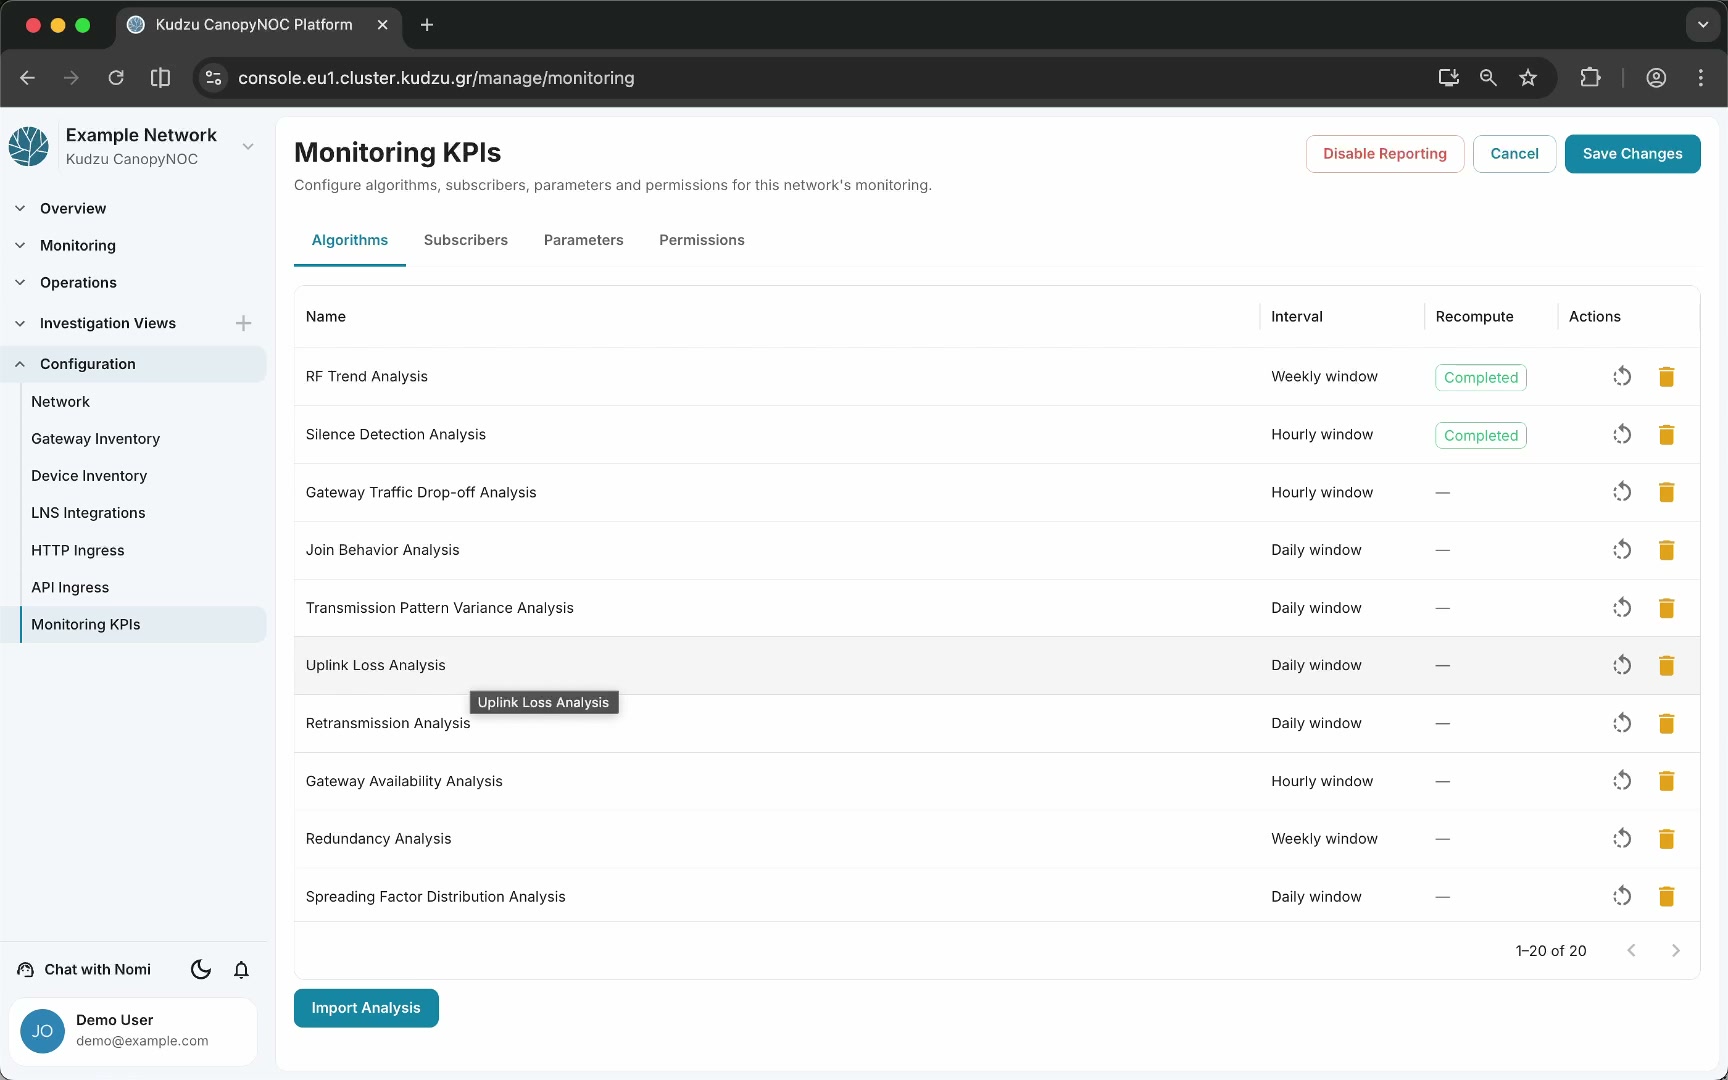
Key areas#
Analysis algorithm list#
The main view shows the analysis algorithms currently registered for your network. Each entry displays the algorithm name and its configuration status.
Import analysis#
Click Import Analysis to open a selection dialog listing all available analysis algorithms in the system. Browse the available algorithms, select one or more to import, and click Select to register them for your network.
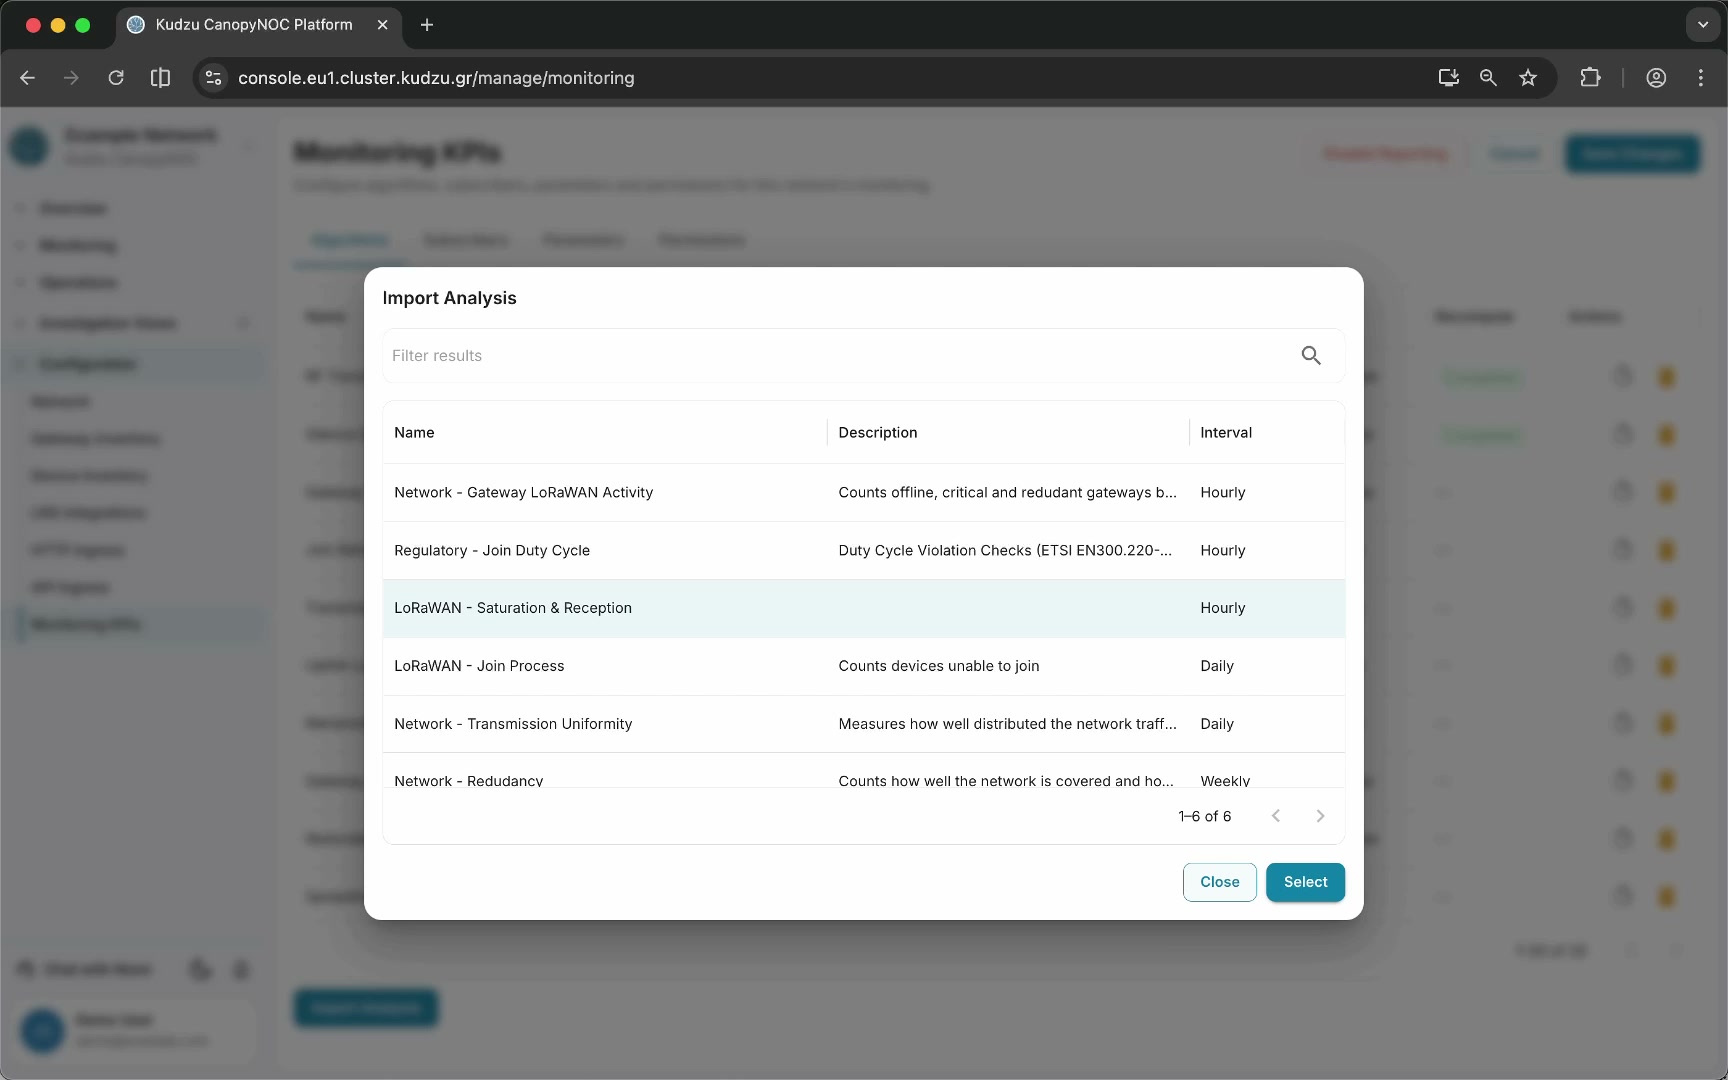
Once an analysis algorithm is registered, its metrics become available on the Metrics Dashboard and can trigger alarms in the Action Center.
Navigation shortcut from Metrics Dashboard#
You can also reach this page from the Metrics Dashboard by clicking the settings icon (gear) next to the search/filter bar. This navigates directly to the Monitoring KPIs configuration page.

How to use this view#
- Navigate to Configuration > Monitoring KPIs in the sidebar, or click the settings icon on the Metrics Dashboard.
- Review the list of currently registered analysis algorithms.
- Click Import Analysis to add new algorithms.
- Browse and select the desired algorithms from the available list.
- Confirm the selection — the new algorithms begin computing metrics that appear on the Metrics Dashboard.
Related pages#
- Network — general network metadata and preferences
- Action Center — alarms triggered by analysis algorithms