Alarms
The Alarms view displays the operational alarm state of your network. It turns computed KPIs into actionable status by showing which metrics have crossed threshold boundaries, at what severity, and how each alarm has evolved over time. Use this view to see all active alarms at a glance, drill into problem categories, inspect individual alarm history, and launch AI-assisted investigations.
Key areas#
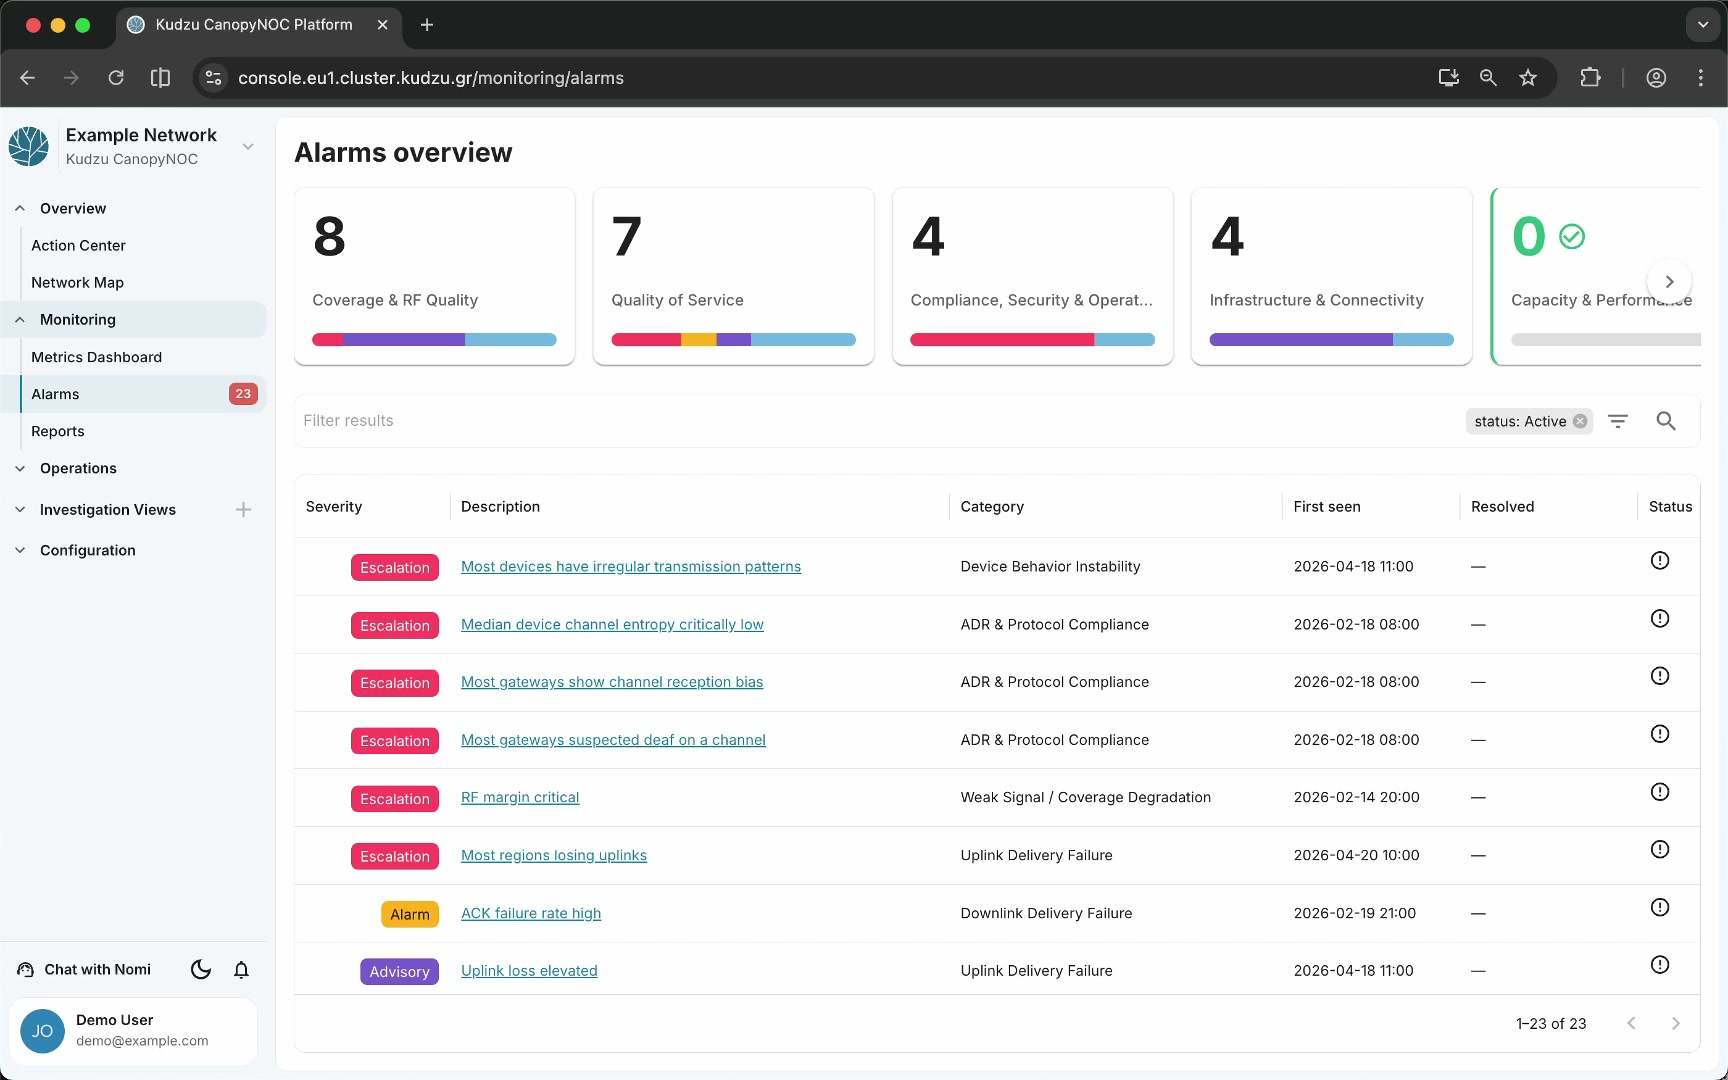
- Category tiles — a horizontal row of tiles for the five root problem taxonomy categories: Coverage & RF Quality, Quality of Service, Compliance, Security & Operations, Infrastructure & Connectivity, and Capacity & Performance. Each tile shows a firing alarm count and a criticality progress bar.
- Alarm list table — a filterable, paginated table of individual alarms with severity, description, category, first-seen date, resolved date, and status columns.
- Filter controls — a text filter input and status filter chip (e.g., “status: Active”) for narrowing the alarm list.
How to use this view#
Assess alarm distribution#
Review the category tiles at the top to see how alarms are distributed across problem categories. Each tile shows the count of active alarms and a color-coded bar visualizing the severity mix. A green check icon appears when a category has zero active alarms.
Drill into a category#
Click a category tile to navigate into that category’s subcategory view. The page shows:
- A breadcrumb bar for navigating back up (e.g., “Overview / Coverage & RF Quality”)
- Subcategory tiles with their own alarm counts and criticality bars
- A filtered alarm list showing only alarms in the selected category
- A mini-map displaying geographic features associated with those alarms

Continue clicking subcategory tiles to drill further into the hierarchy, or click an alarm description link to open the metric-level detail.
Inspect alarm detail#
Click an alarm description in the table to open the metric-level alarm detail page. This page shows:
- Metric header — the metric name, description, and an Investigate button.
- Historical chart with alarm markers — a time-series chart enhanced with labeled annotations showing alarm lifecycle events: “raised,” “escalated,” “de-escalated,” and “resolved.” Hover over a marker to see the exact timestamp and metric value.
- Map panel — a map showing geographic features associated with the alarm.
- Alarm history table — the complete event history for the metric, showing each transition with its type, description, severity, and timestamp.

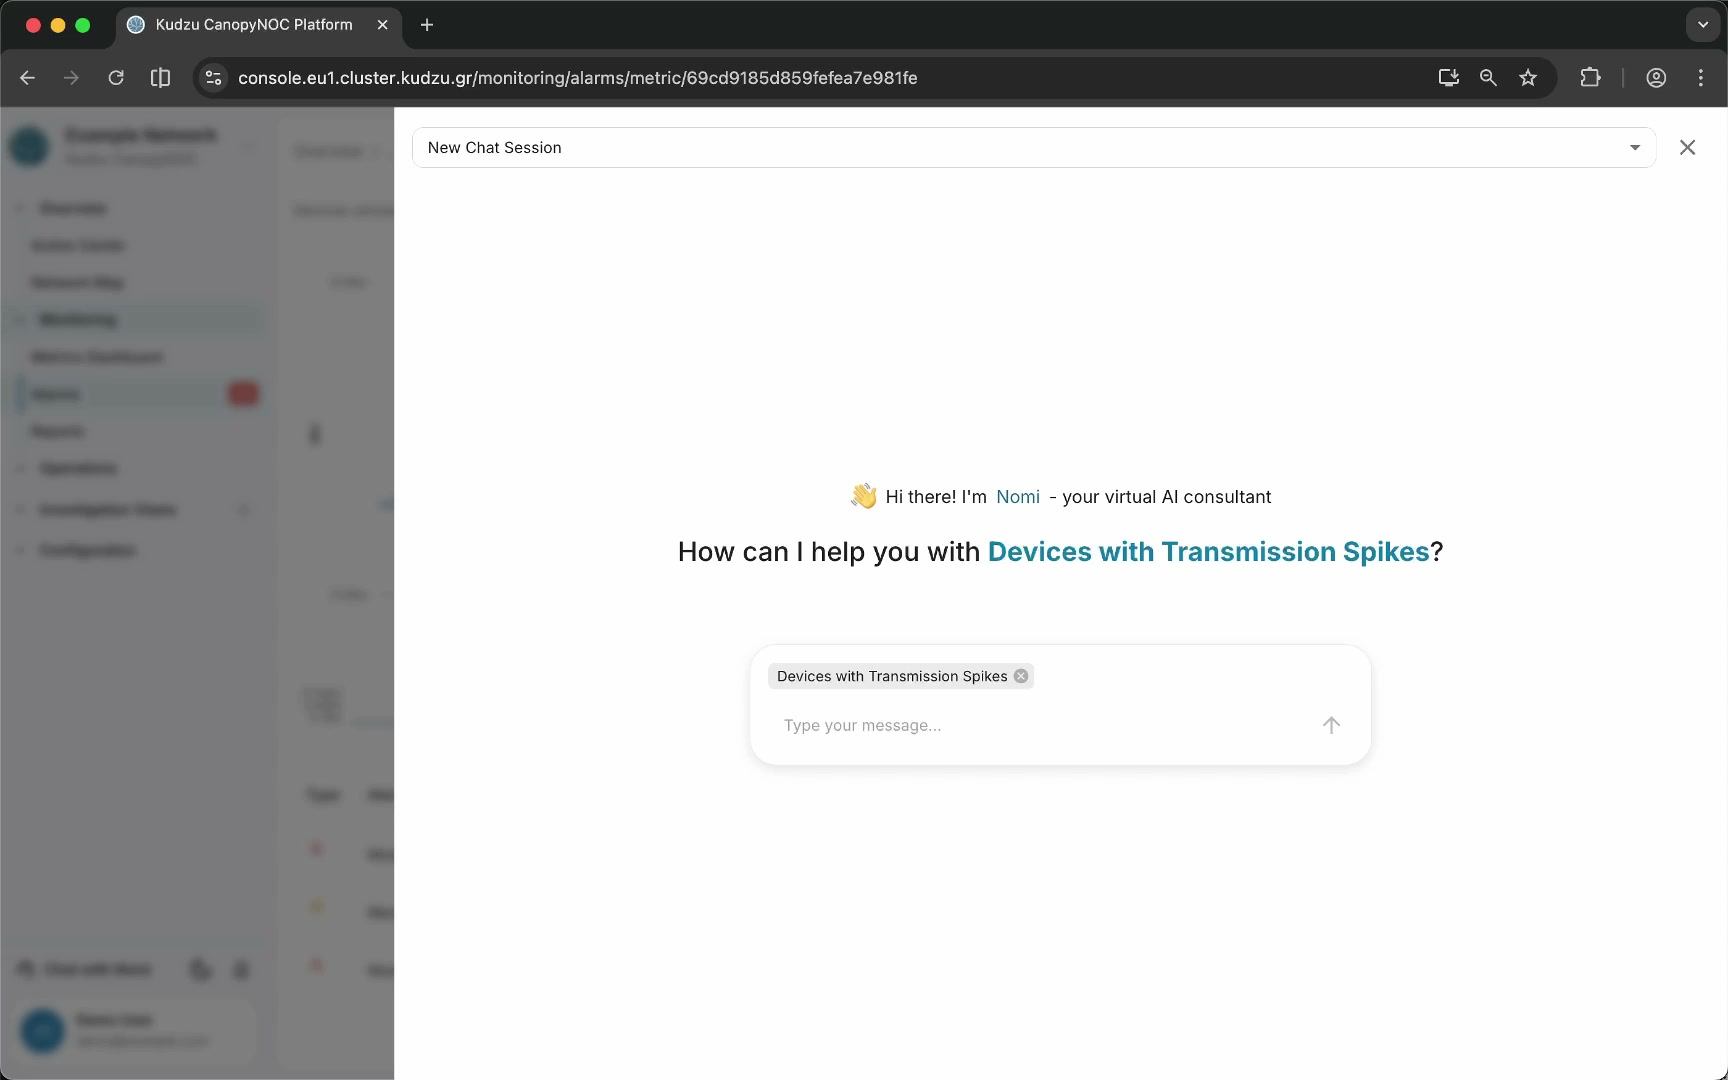
Launch an AI investigation#
Click the Investigate button in the top-right corner of the alarm detail page to open the Nomi chatbot with full context about the alarm. The AI agent guides you through an interactive debugging process to identify the root cause. You can also create and save reports from the investigation session.
Understanding the data#
| Alarm marker | Meaning |
|---|---|
| Raised | The alarm was first triggered — the metric crossed a threshold boundary |
| Escalated | The alarm severity increased |
| De-escalated | The alarm severity decreased |
| Resolved | The alarm returned to normal — the metric is back within bounds |