Action Center
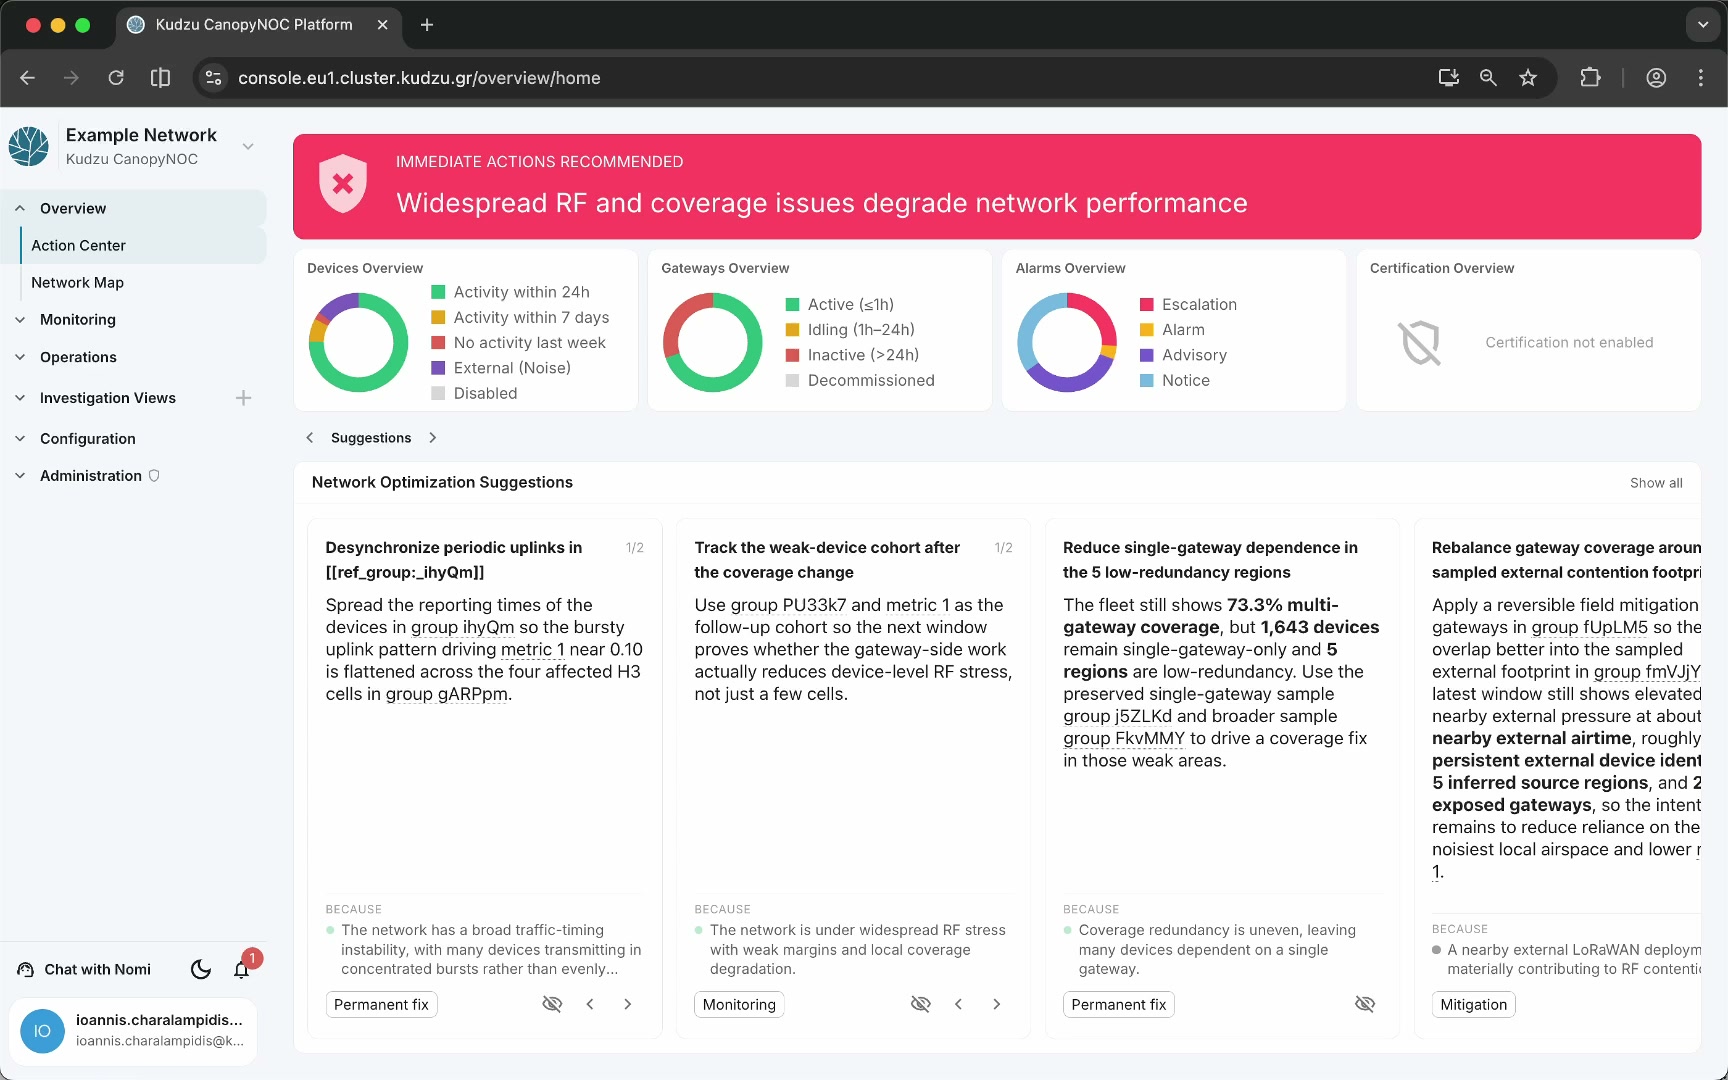
The Action Center is the first screen you see after logging in to Kudzu Canopy NOC. It gives you an immediate read on network health, summarizes device, gateway, alarm, and certification state, and presents AI-computed network optimization suggestions with detailed remediation guidance.
Key areas#
- Network status banner — a color-coded banner at the top of the page. Green indicates a healthy network, yellow signals a warning state, and red means immediate attention is recommended.
- Devices Overview widget — a donut chart showing device status: activity within 24 hours, activity within seven days, no activity this week, external noise, and disabled devices.
- Gateways Overview widget — shows gateway status across four categories: active (traffic within the last hour), idling (no traffic for one to 24 hours), inactive (no traffic for more than a day), and decommissioned.
- Alarms Overview widget — summarizes active alarms by criticality level: escalation, alarm, advisory, and notice.
- Certification Overview widget — reflects certification state when certification is enabled. Shows whether you are resolving issues within the agreed SLA and maintaining the current certification badge.
- Network Optimization Suggestions — AI-generated recommendation cards in the lower portion of the page.
How to use this view#
Assess network health#
Start with the status banner to decide whether the network needs immediate attention. Then review the four overview widgets to understand whether the issue is concentrated in devices, gateways, alarms, or certification state.
Review optimization suggestions#
Scan the suggestion cards for recommendations with the most relevant strategy tag or problem statement. Each card includes:
- A short recommended action
- A Because section explaining the underlying problem
- A strategy label such as Permanent fix, Monitoring, or Mitigation
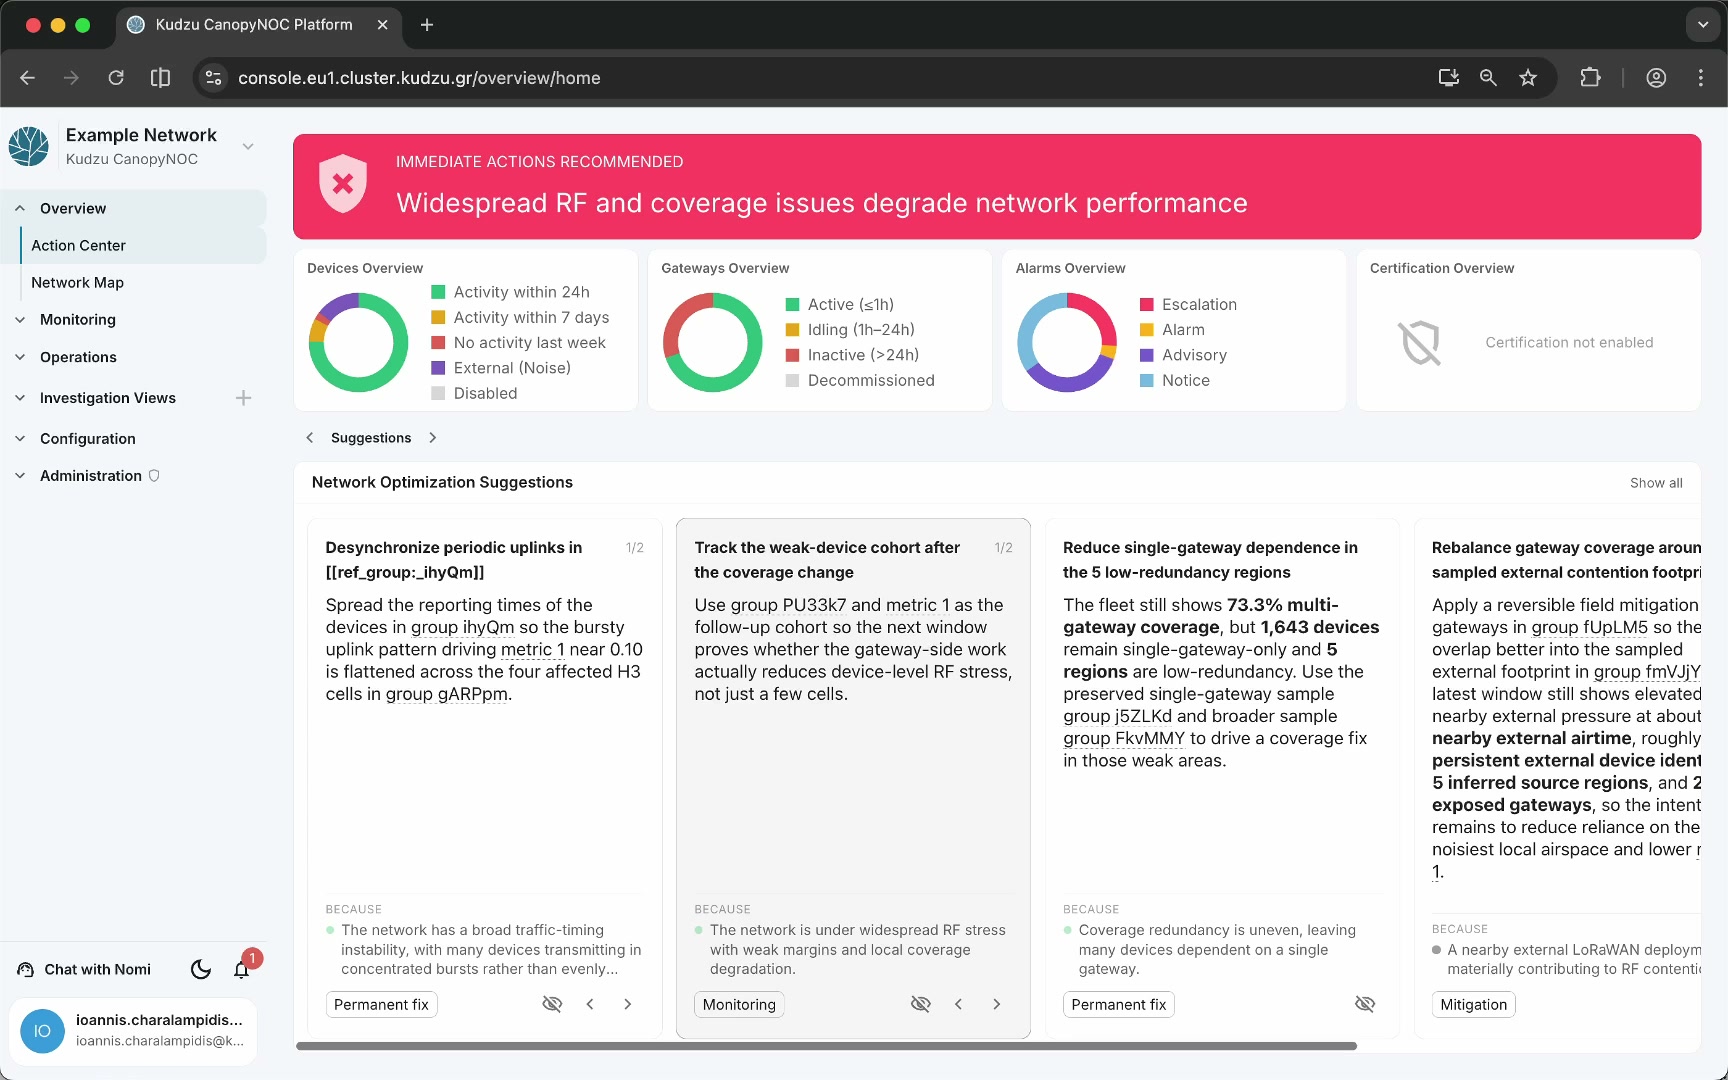
Use the left and right arrows on a card to cycle through multiple suggested solutions for the same underlying problem. Click a card to open the full solution details view with implementation instructions, checklists, and evidence.
Manage suggestion visibility#
Click the eye icon on a card to hide a suggestion that is no longer relevant or has already been addressed. Click Show all to restore previously hidden suggestions.
Onboarding view#
When a network has not completed initial setup, the Action Center displays an onboarding view instead of the normal status dashboard.
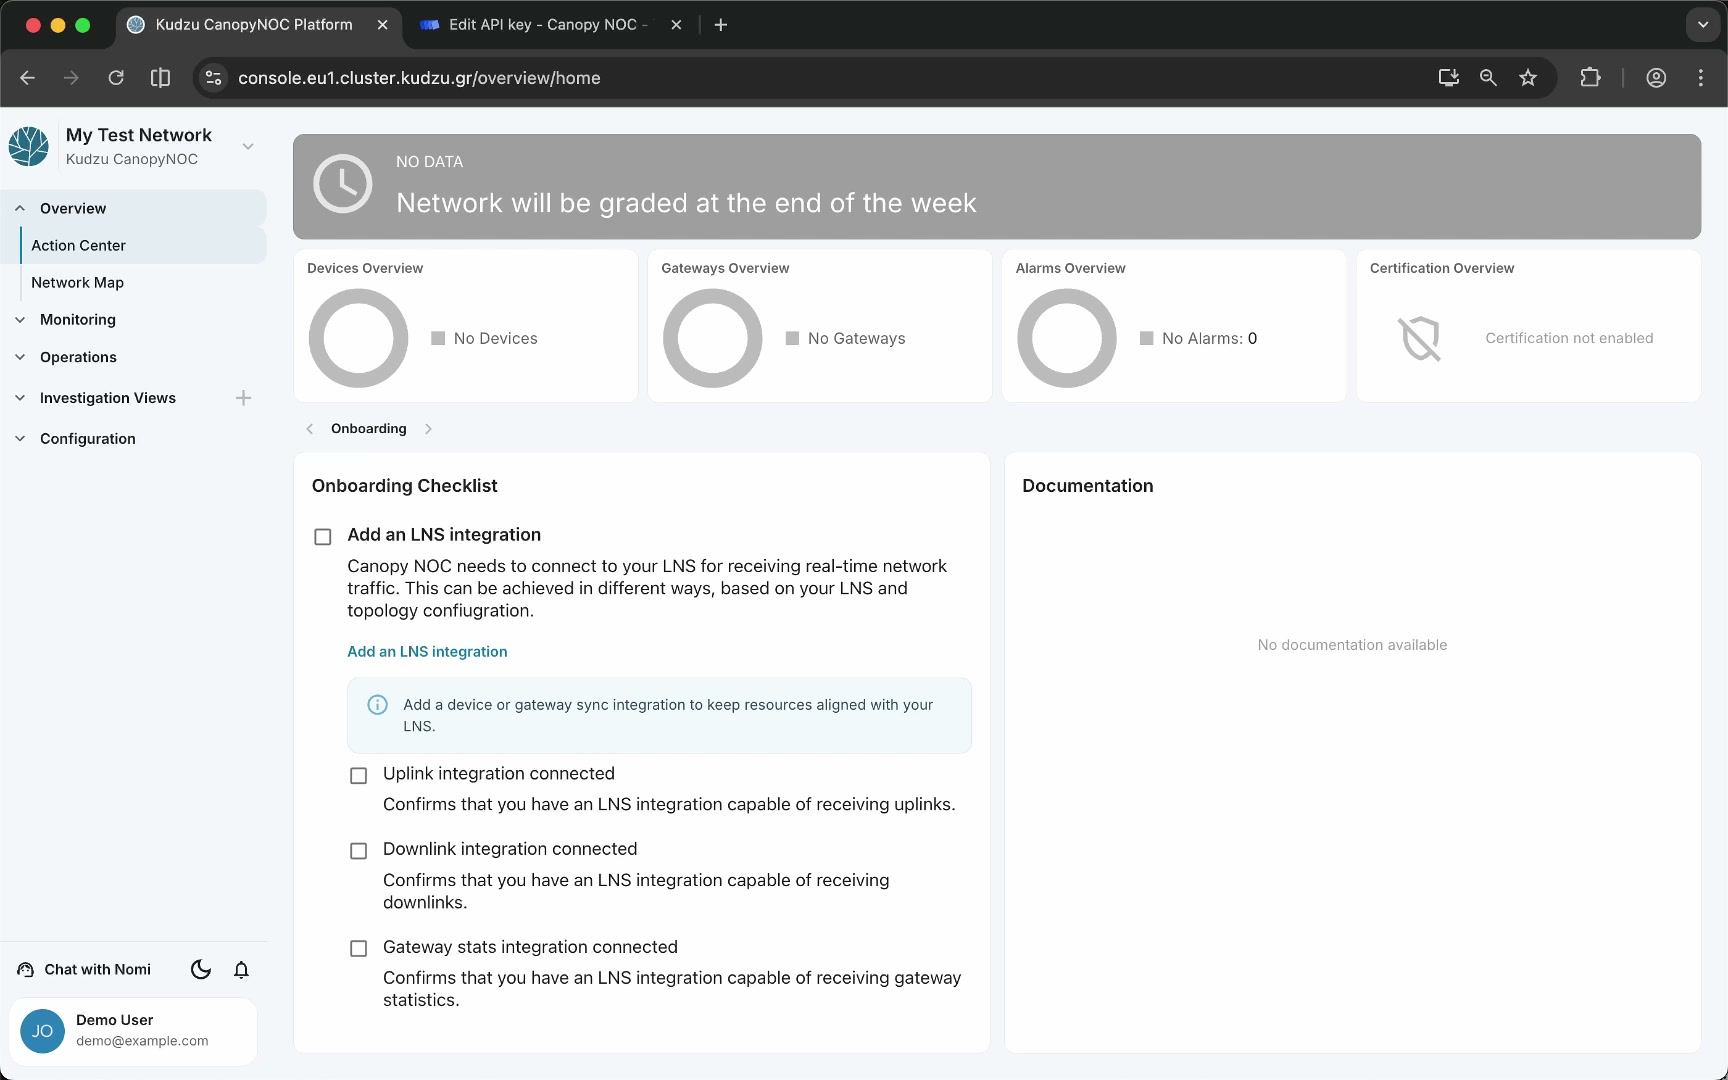
In this state, the network status area shows a “No data” banner with the message “Network will be graded at the end of the week.” The overview widgets are present but display no data. The lower portion shows an onboarding checklist:
- Add LNS integration — links to LNS Integrations configuration.
- Add your network devices and gateways — checked automatically when devices and gateways synchronize through an integration.
- Import dashboards in your investigation views — links to Investigation Views import.
- Enable network monitoring — links to the Metrics Dashboard to enable reporting and import analysis algorithms.
- Wait for data — checked automatically once the platform receives and processes initial network traffic.
Each checklist item is clickable and navigates to the relevant configuration view. Items are checked automatically as prerequisites are satisfied. The onboarding view transitions to the normal Action Center once all items are complete and network data begins flowing.