Kudzu Analytics has native integration capabilities with The Things Stack (version 3) deployments, supporting both The Things Network (TTN) community and The Things Industries (TTI) private deployments.
Before proceeding with the integration, ensure your cluster is configured as follows:
1. Configure Your Cluster
Kudzu Analytics connects to your cluster deployment and subscribes to an event stream from all your gateways using a dedicated API key.
To streamline the integration process, it’s best to organize your gateways under a specific organization and generate an API key for it. If you already have one or more organizations, it’s recommended to create a separate one for the Kudzu Analytics integration.
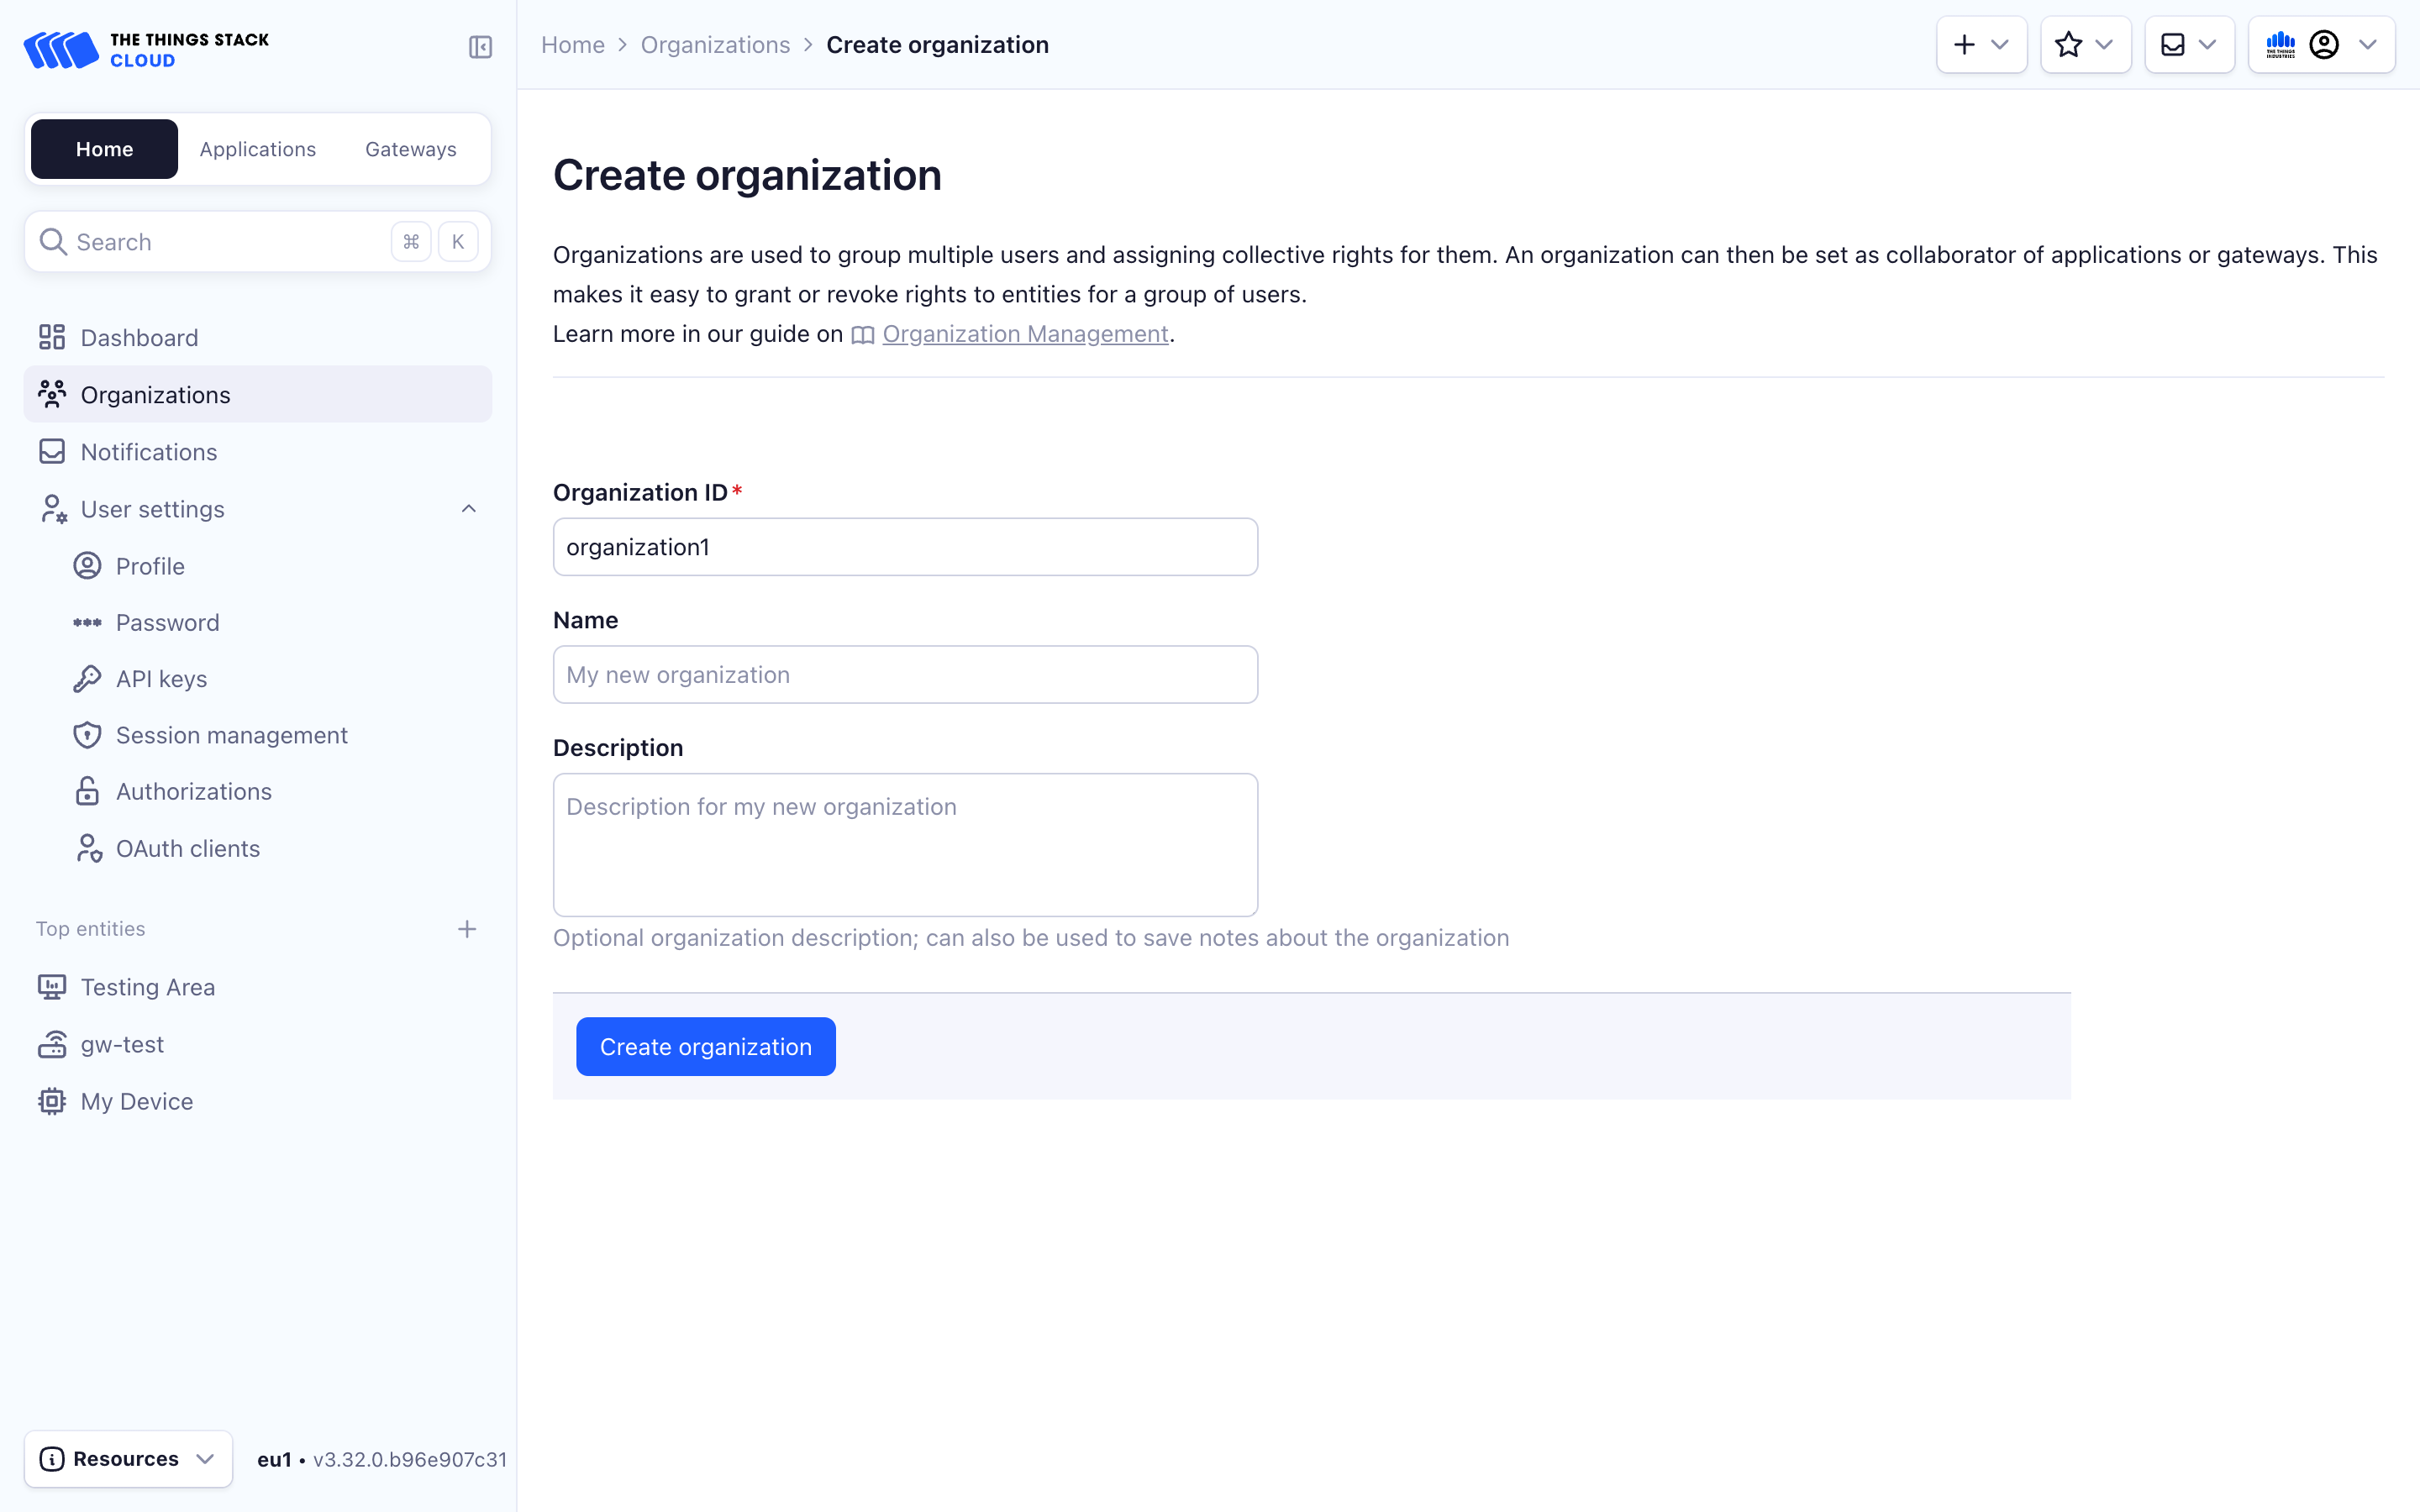
1.1. Create an Organization
Log into your TTN/TTI V3 instance and create an organization.
1.2. Create an API Key
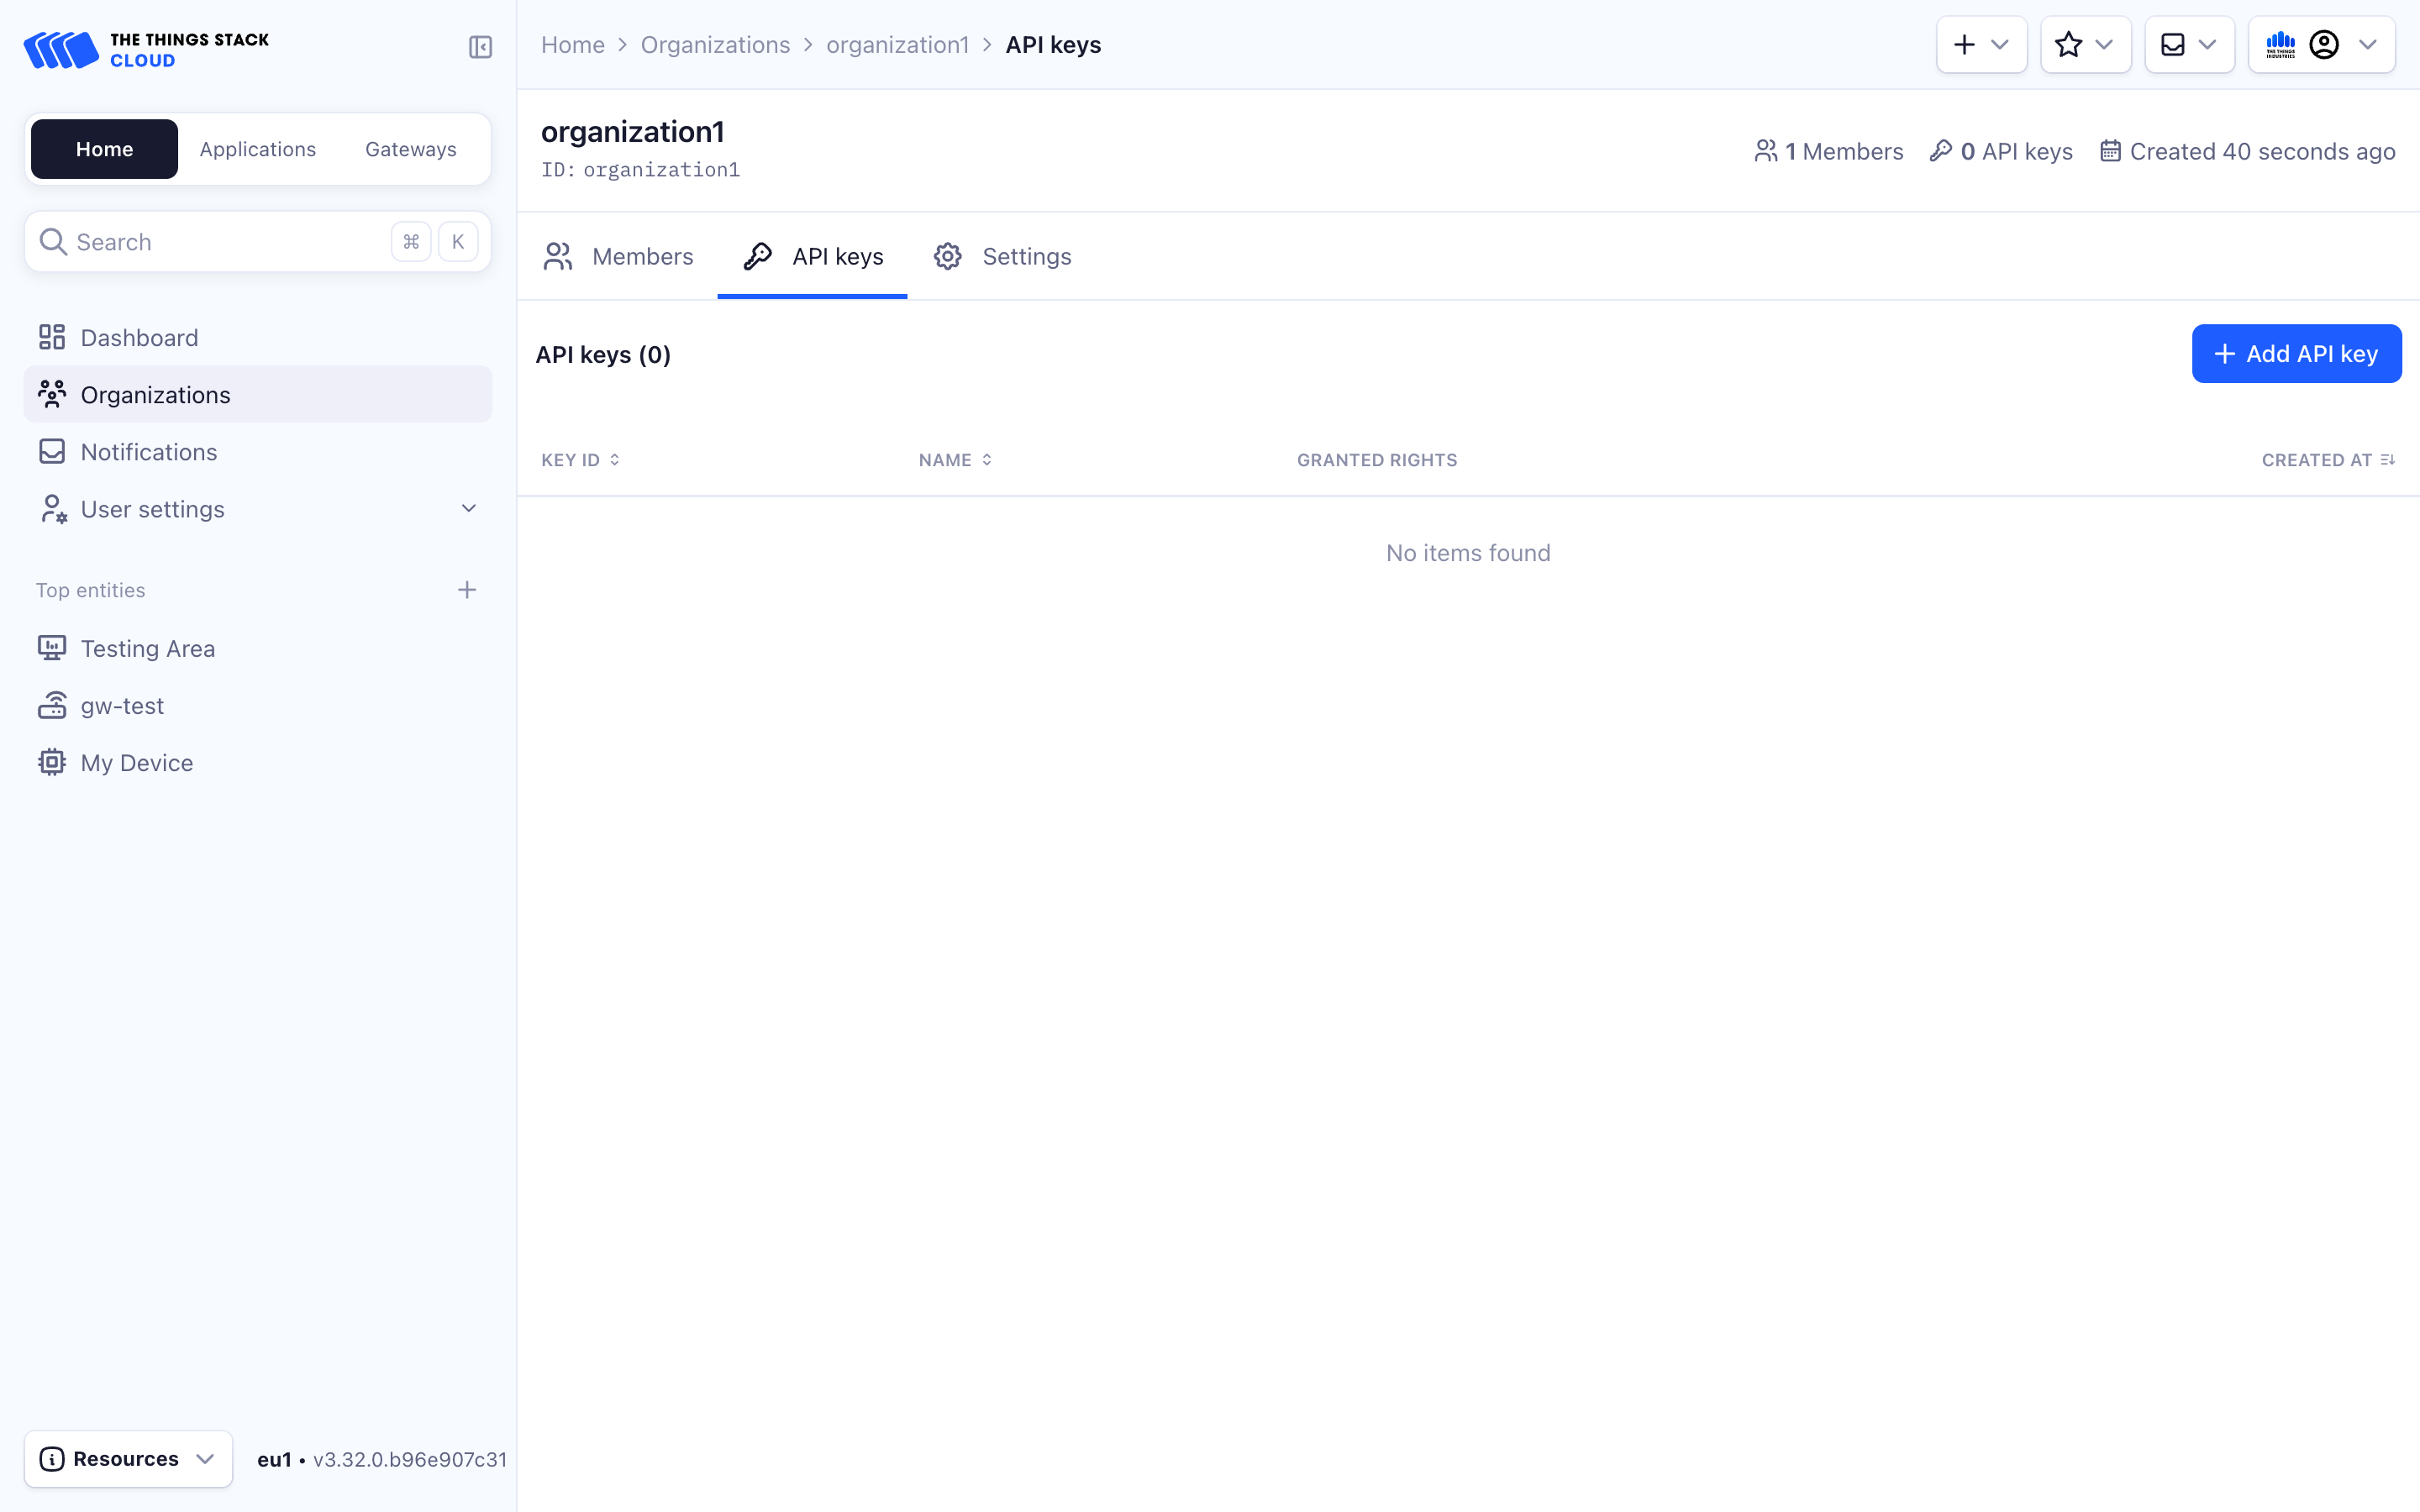
Once your organization is ready, create an API Key to share with Kudzu Analytics.
While creating the API key, the default option is “Grant all current and future rights.” However, since Kudzu Analytics only needs specific rights, it is highly recommended to select only the necessary individual rights:
- View gateway information
- View gateway location
- View gateway status
- Read gateway traffic
- List gateways the organization is a collaborator on
After selecting these rights, create the key and save it for later use in the integration configuration.
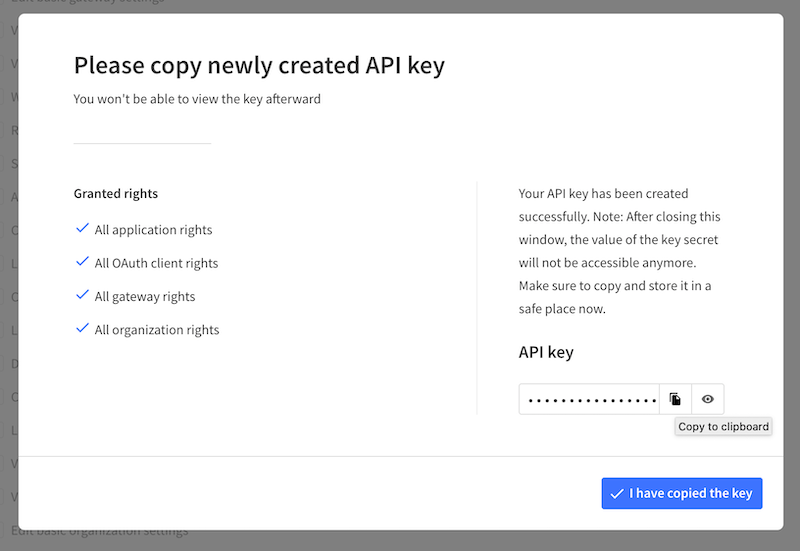
1.3. Copy the API Key
Click Create API Key and copy the generated key to your clipboard.
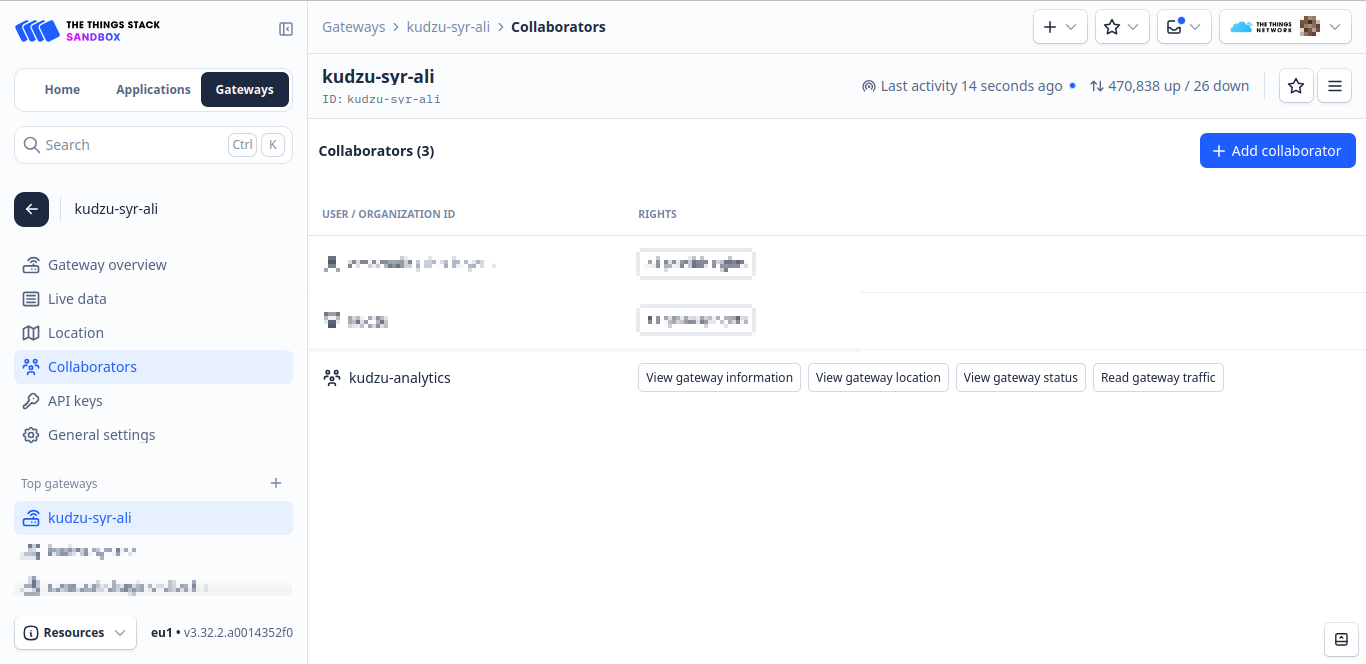
1.4. Add the Organization as a Collaborator to Your Gateways
Add the newly created organization as a collaborator to each gateway you want to monitor in Kudzu Analytics. Click on the Gateways link and add your organization as a collaborator for the gateways:
Your TTI instance is now ready to send events to Kudzu Analytics. You can return to Kudzu Analytics to complete the integration setup.
2. Configure Your Network Integration
With your TTI instance configured, proceed with the next steps to set up your Kudzu Analytics integration:
2.1. Open the Network Settings
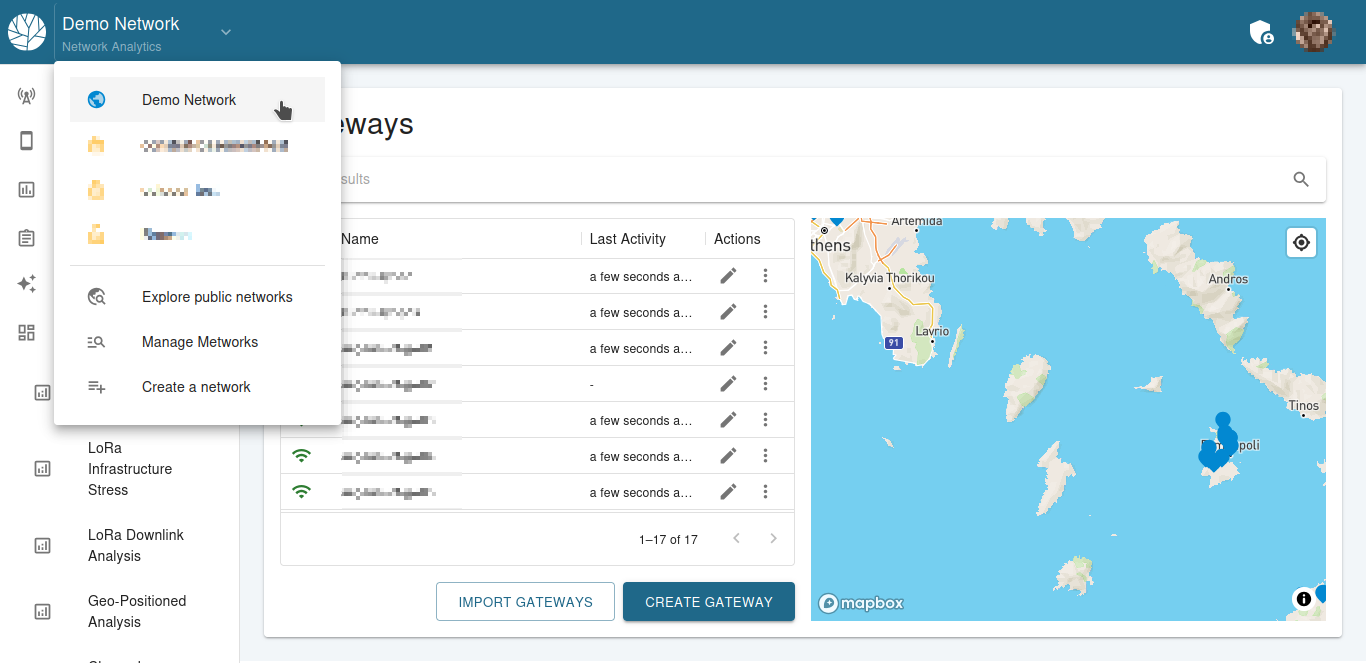
Click on the Networks link in the top navigation and select the network where you want to add the integration from the side menu.
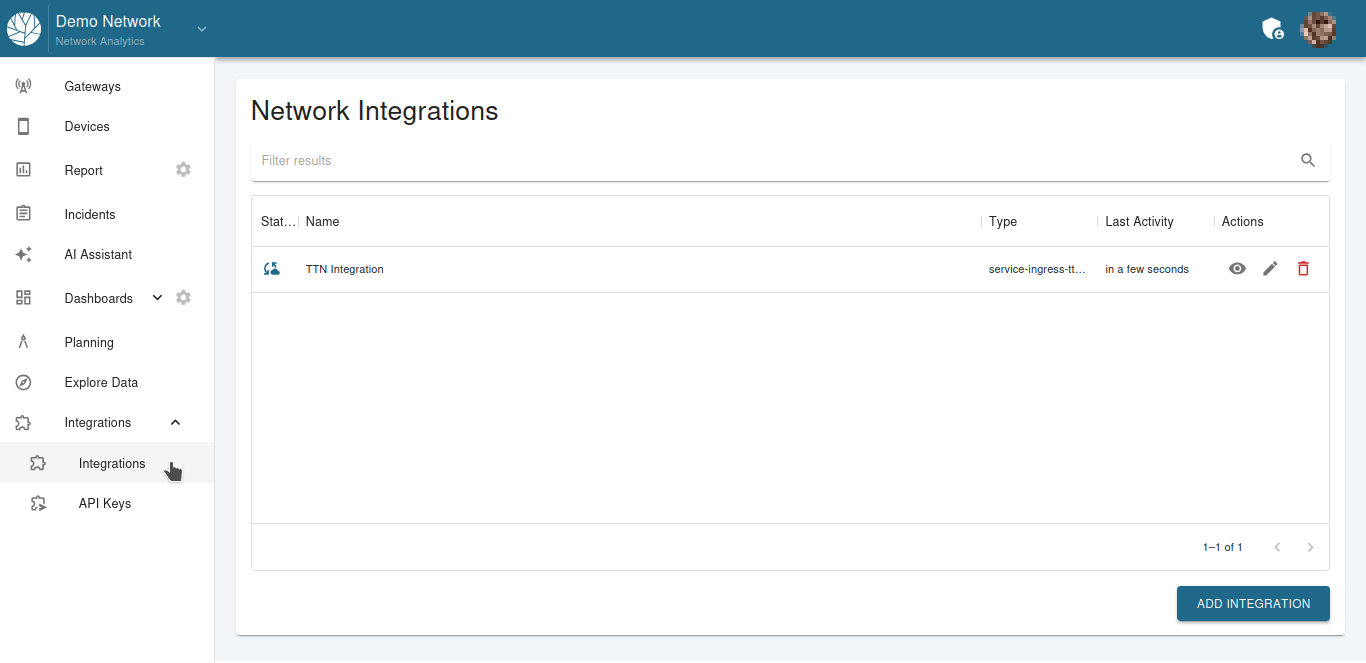
Click the Integrations drop down menu in the left panel.
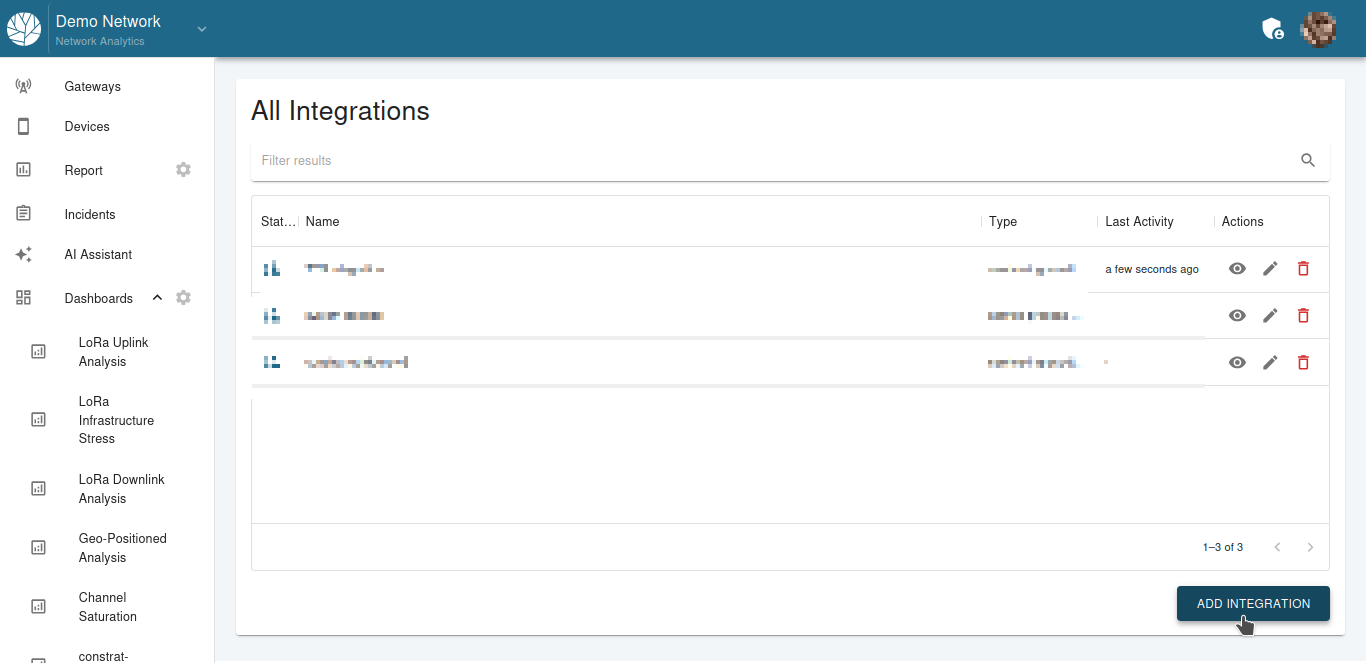
2.2. Add an Integration
Under Integration Interfaces, click Add Integration.
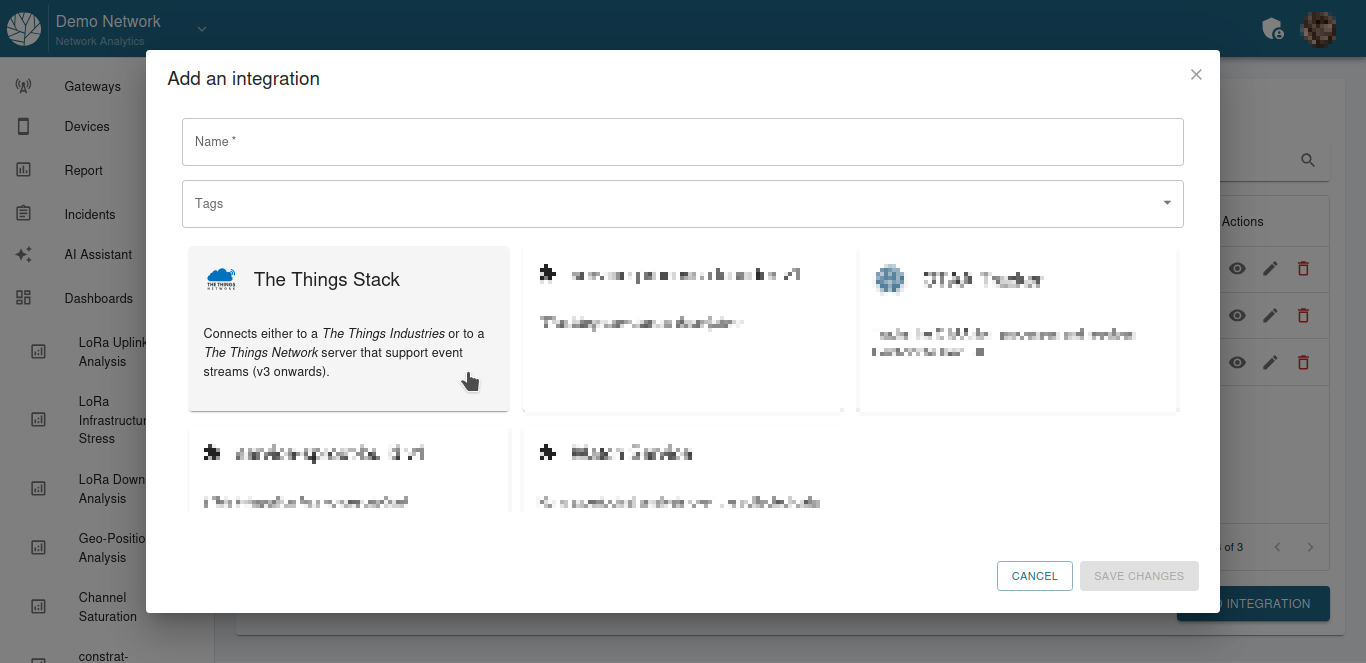
On the Add Integration pop up window, select "The Things Stack".
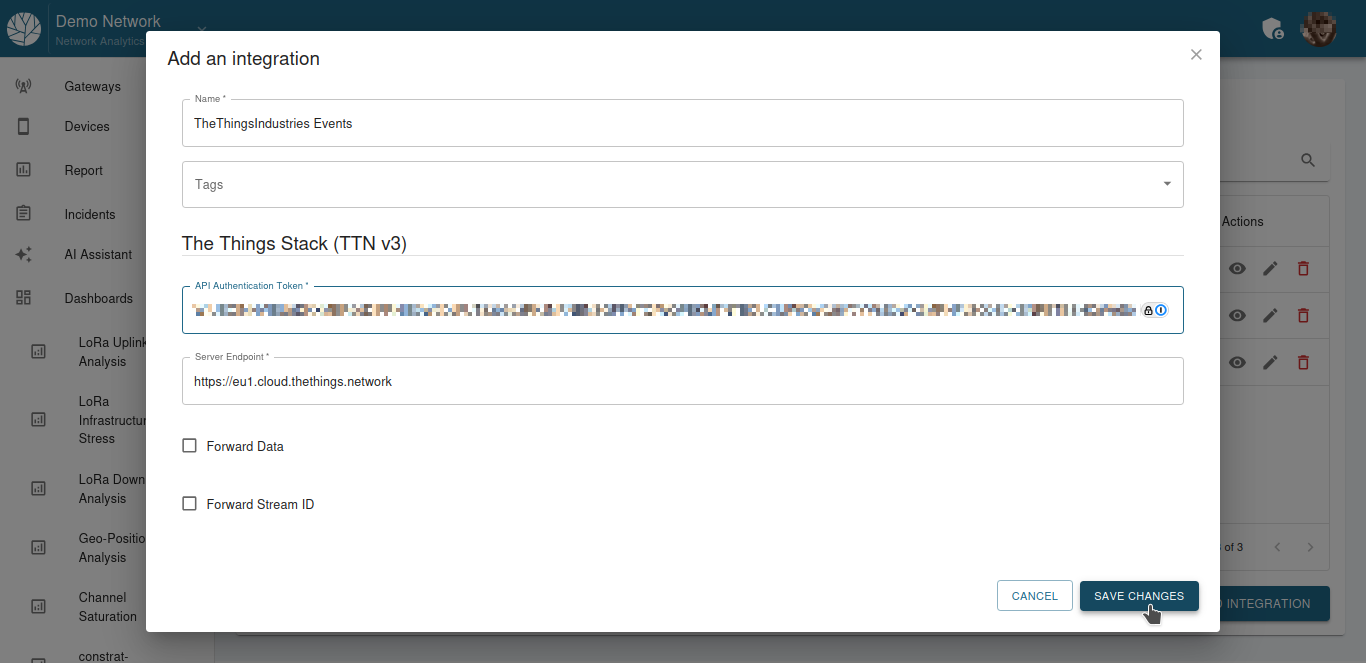
2.3. Configure Your Integration
In the next step you can now add a meanigfull name for your integration and also add some tags to it.
Copy the API key you created in the previous steps and check the server endpoint. By default, the server endpoint is configured to the european TTS sandbox cluster.
If you are using Kudzu Analytics for your european TTS sandbox cluster you can leave this unchanged. In any other case, you must add the correct server endpoint.
You can leave the Forward Data and Forward Stream ID checkboxes unchecked.
3. Import your gateways
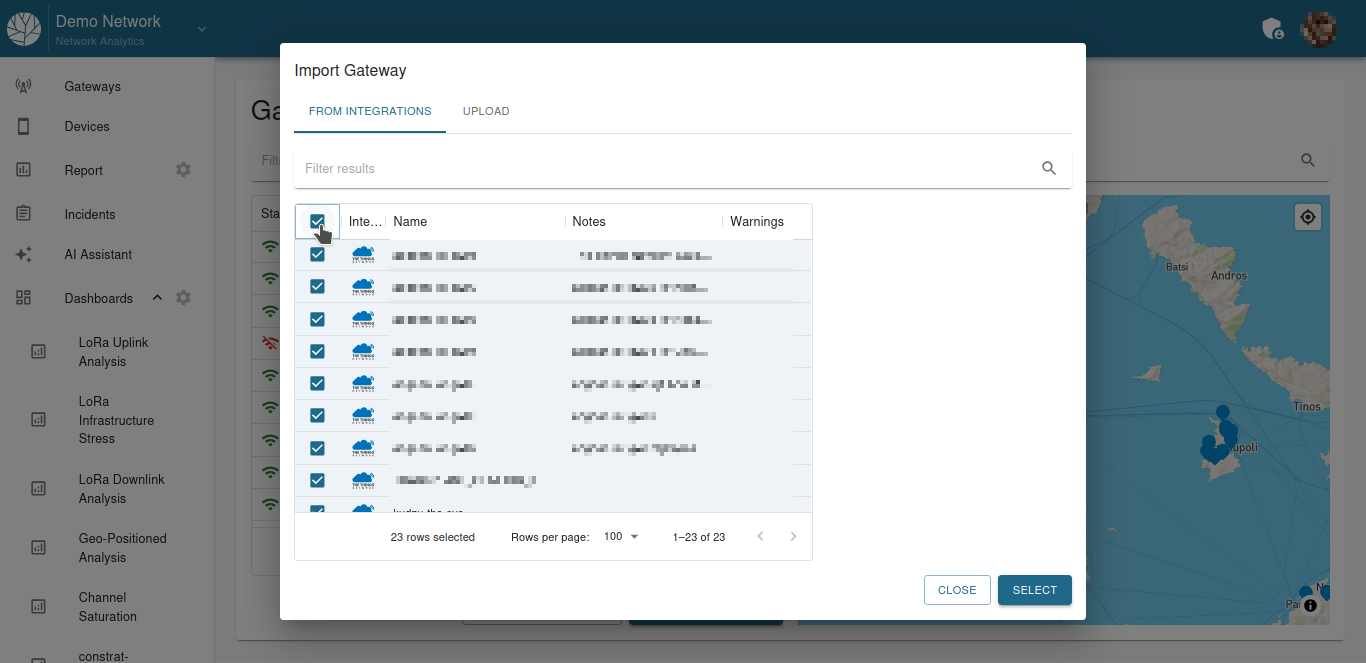
Now that both your TTS/TTI instance and Kudzu Analytics integration are configured, you can choose to import your gateways directly from TTS/TTI.
First go to your Gateways tab on the ledt panel.

Then click on Import Gateways. A new pop up window will appear where you can select the gateways to import.
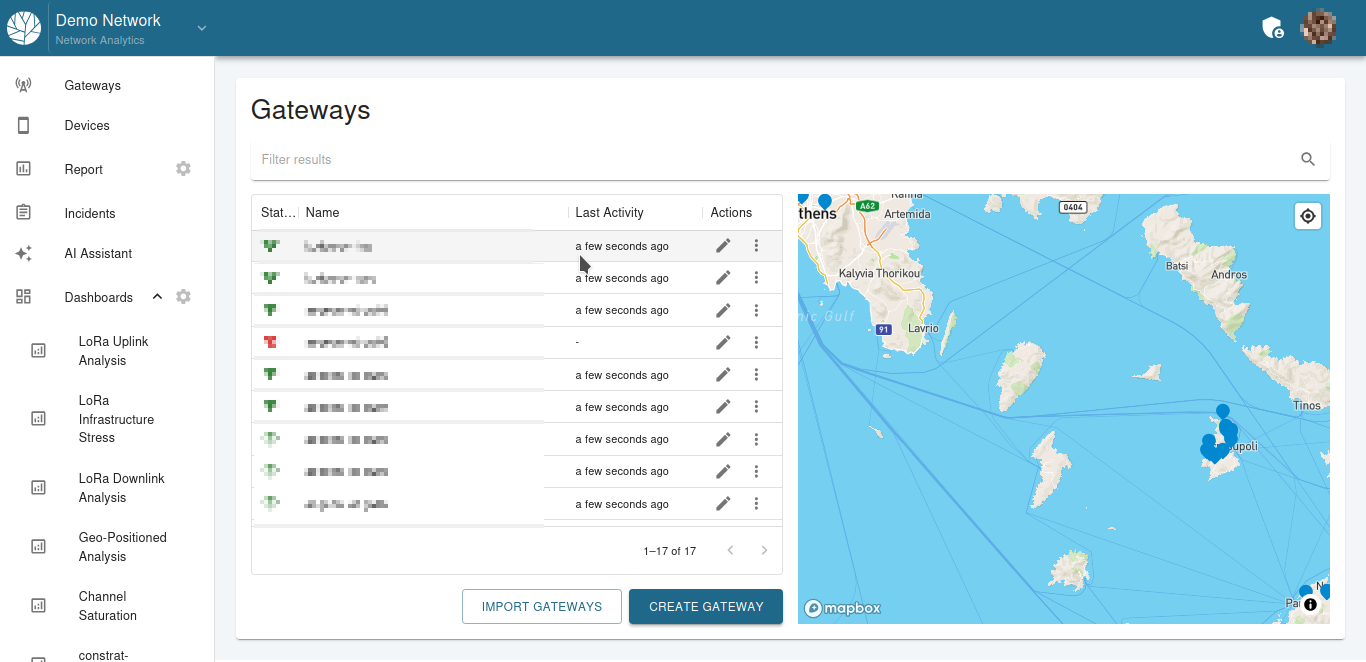
Ιf your gateways are up and running you should be able to see data incoming within a few minutes.
4. Import Dasboards
With your gateways imported, now it’s time to start viewing some real time data. You can do this by importing the preconfigured dashboards. To do this click on the gear button next to the Dashboards tab in the let panel.
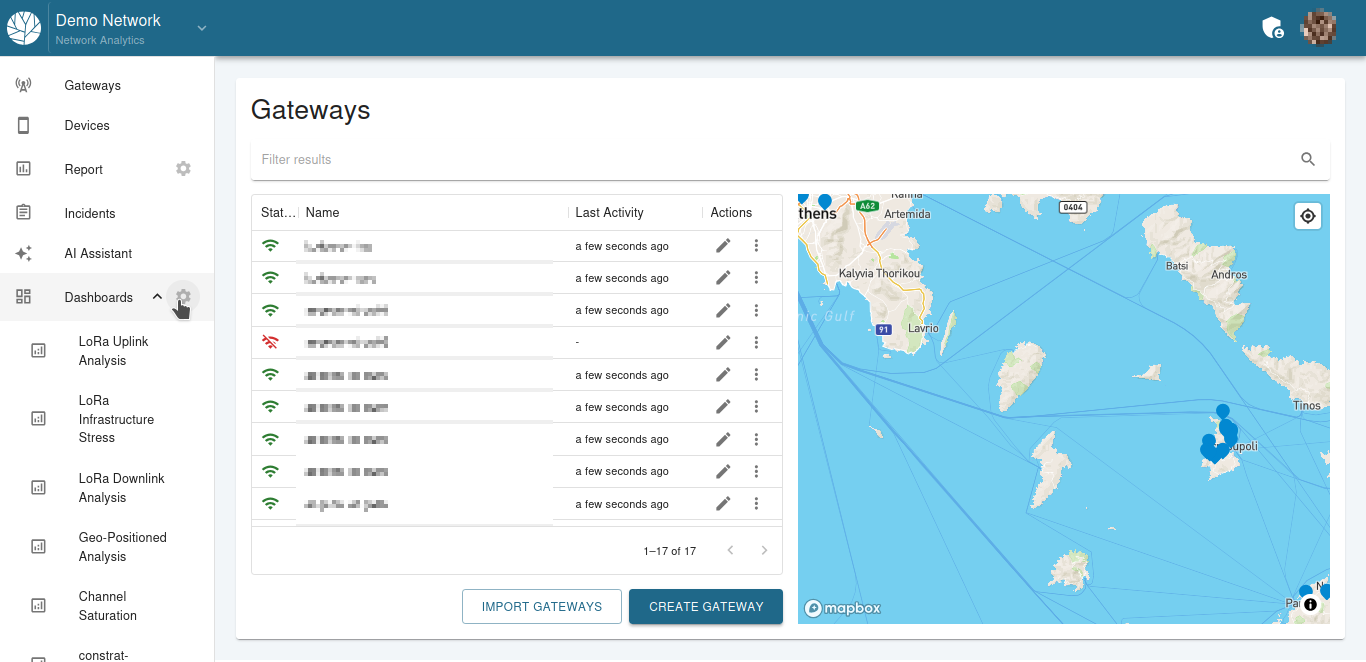
In the new window an empty list of available dashboards will appear. Click on Import Dashboard on the bottom right button.
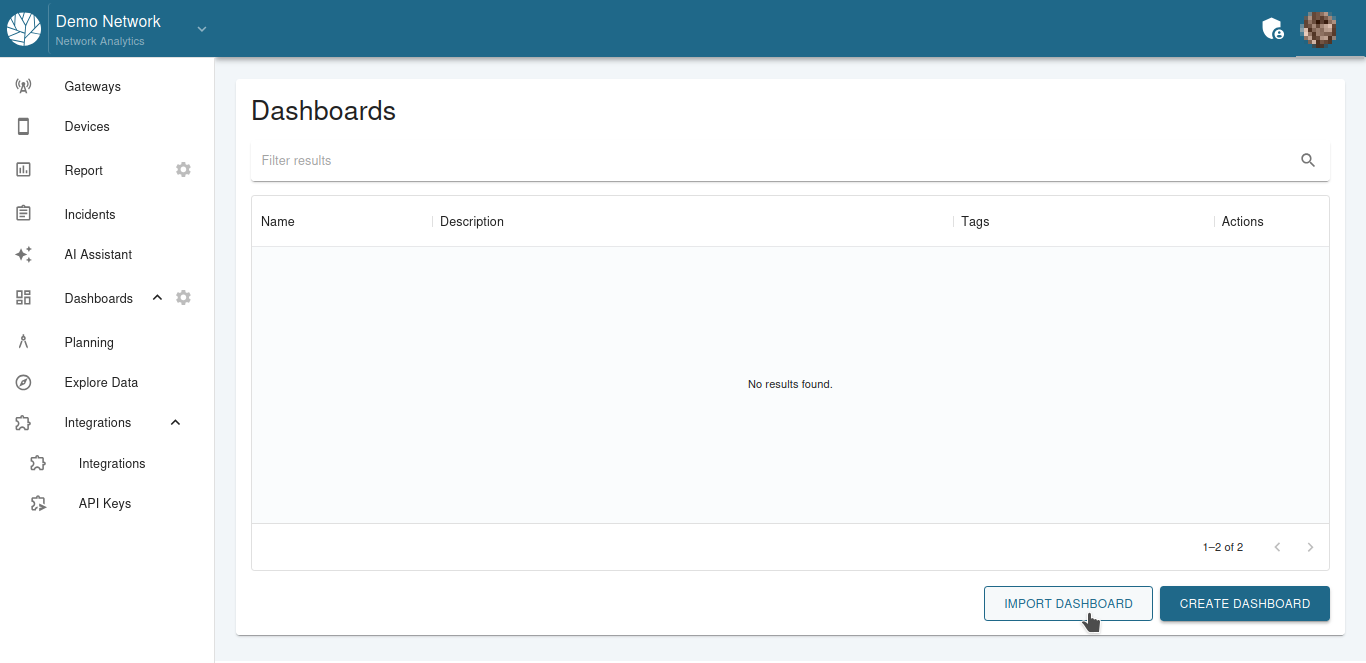
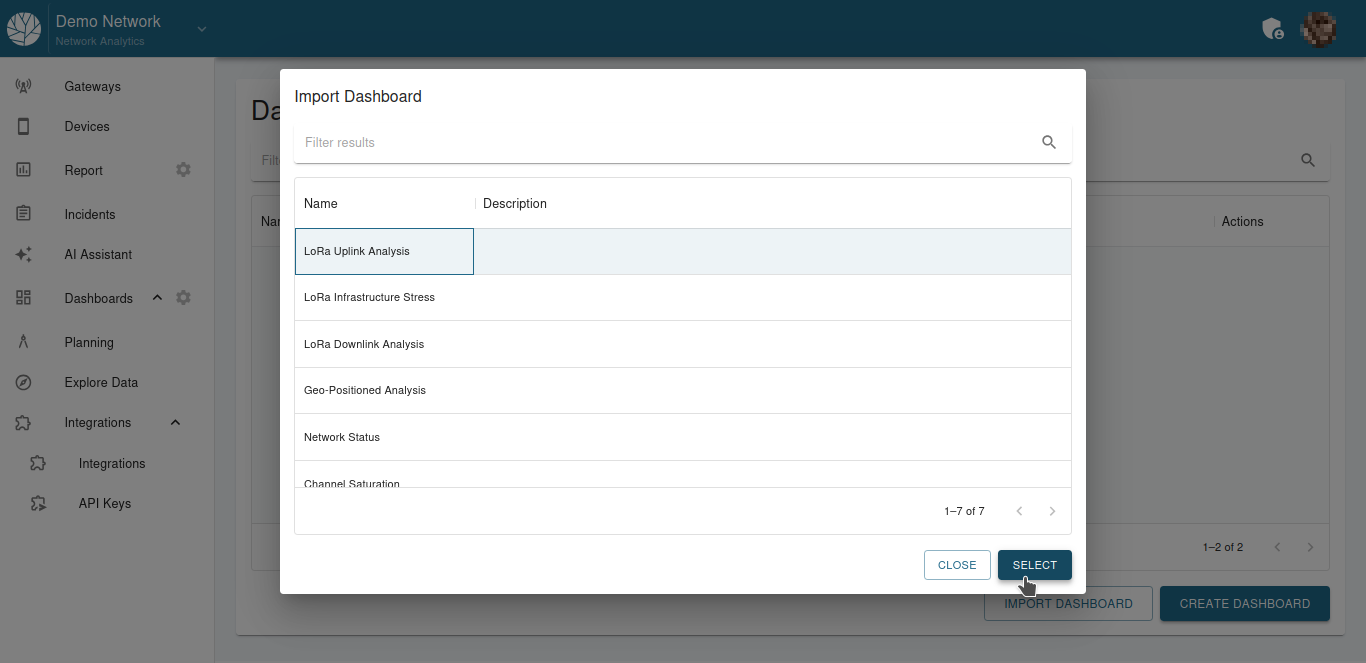
A new pop up window will appear with a list of predefined dashboards. Here you can select and import your dashboard.
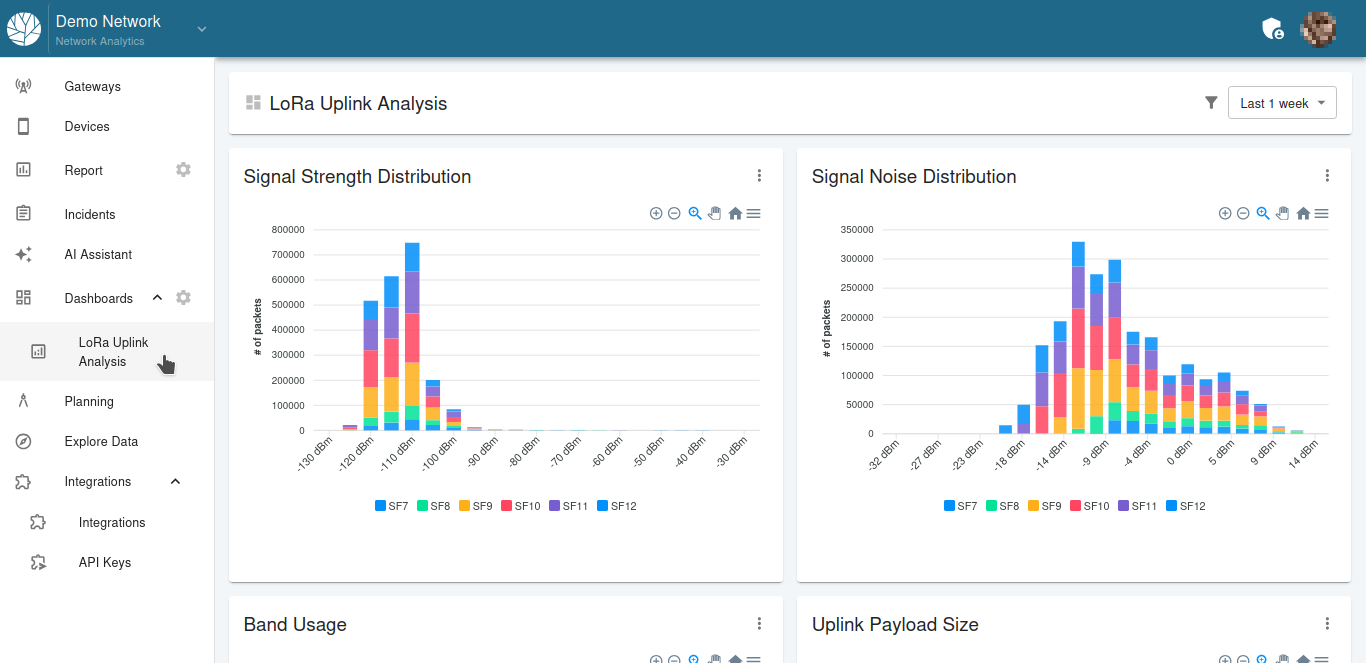
Your dashboard has now been succesfully imported. You can view your dashboard on the left side panel under the Dashborads menu
This guide provides detailed instructions for integrating TheThingsStack with Kudzu Analytics. For additional help, please contact Kudzu Support.