Track Network Deployment
This guide explains how to use the Deployment view in Canopy NOC to track the progress of a LoRaWAN network installation. The view compares planned RF coverage and gateway locations from a network planning simulation against actual field installations.
Before you begin#
- Confirm you have an active Canopy NOC account with access to the network being deployed.
- Verify that the Kudzu engineering team has loaded an RF network planning simulation for your deployment area.
- Coordinate with your field operations team so they can update cell statuses as installations proceed.
Step 1 – Open the Deployment view#
Navigate to Operations > Deployment in the sidebar. The view opens a full-screen map of your deployment area.
Step 2 – Select a preset view#
Use the preset dropdown in the top-right corner to switch between three views:
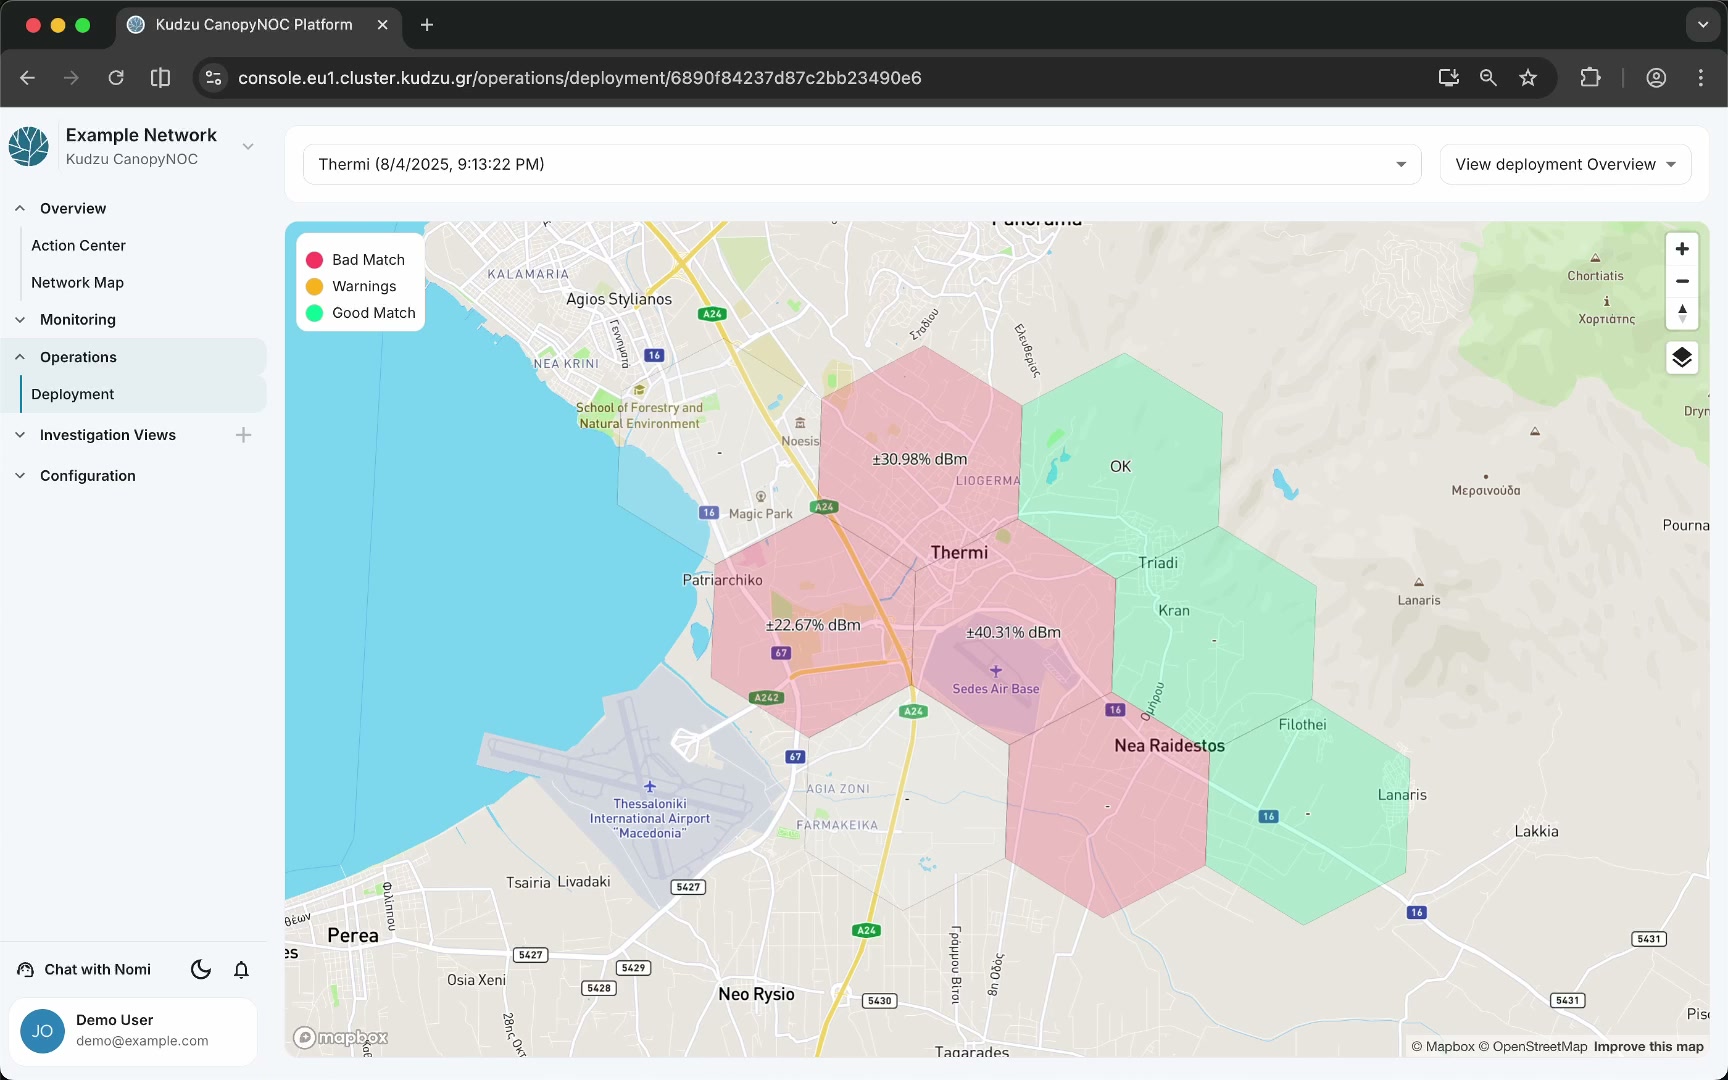
- View Deployment Overview – shows hexagonal cells colored by deployment progress (red, blue, or green).
- View Gateway Location and Coverage – shows the simulated RF quality map with planned gateway locations as blue rings.
- View Device Locations – shows planned and observed device positions.
Start with View Deployment Overview to get a high-level picture of progress.
Step 3 – Inspect hexagon cells#
Each hexagonal cell represents a deployment zone and is colored by status:
| Color | Meaning |
|---|---|
| Green | Fully deployed – all expected gateways are installed and matched |
| Blue | Partially deployed or in progress |
| Red | Not yet matching simulation expectations – gateways are missing or misplaced |
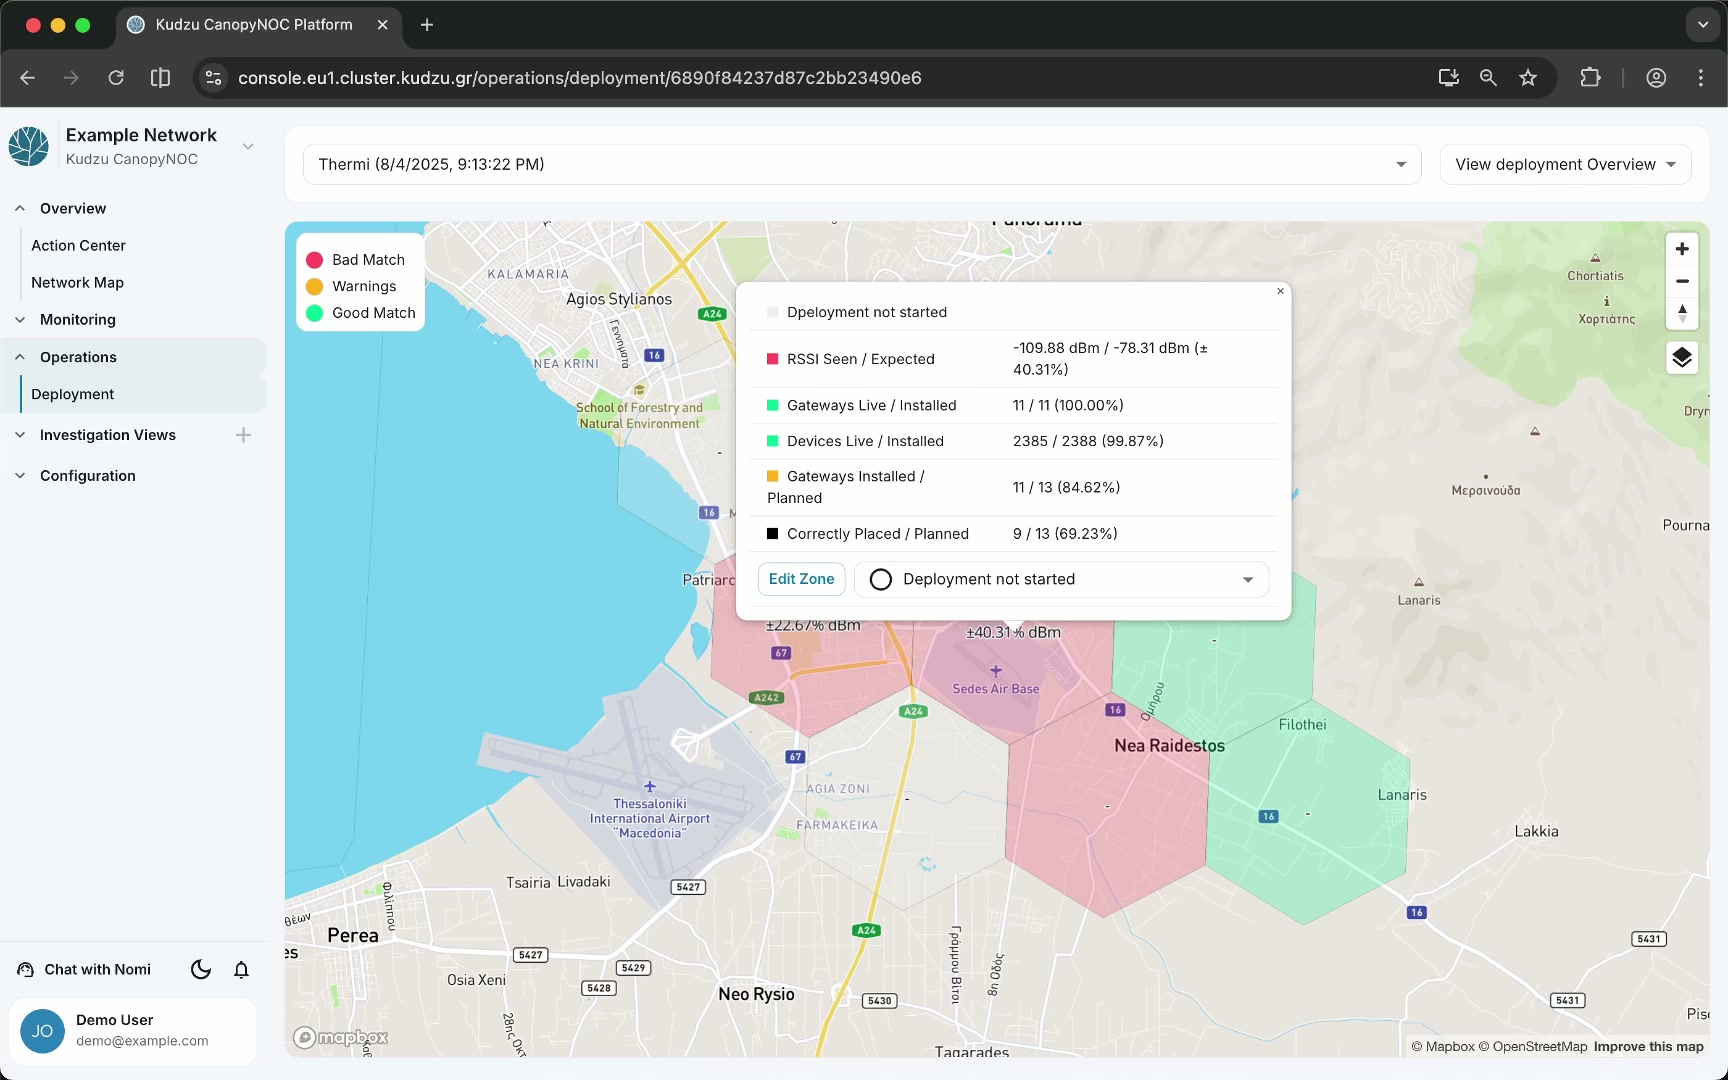
Click any cell to open a detail popup where you can:
- View the current deployment status.
- Set the cell stage: not started, deployment in progress, completed, or ignored.
- Add notes for the field team or network operator.
Step 4 – Compare planned vs. actual gateways#
Switch to the View Gateway Location and Coverage preset to see the RF simulation overlay and gateway placement status.
- Dark blue rings indicate a planned location where an actual gateway installation has been matched.
- Light blue rings indicate a planned location where no gateway has been installed yet.
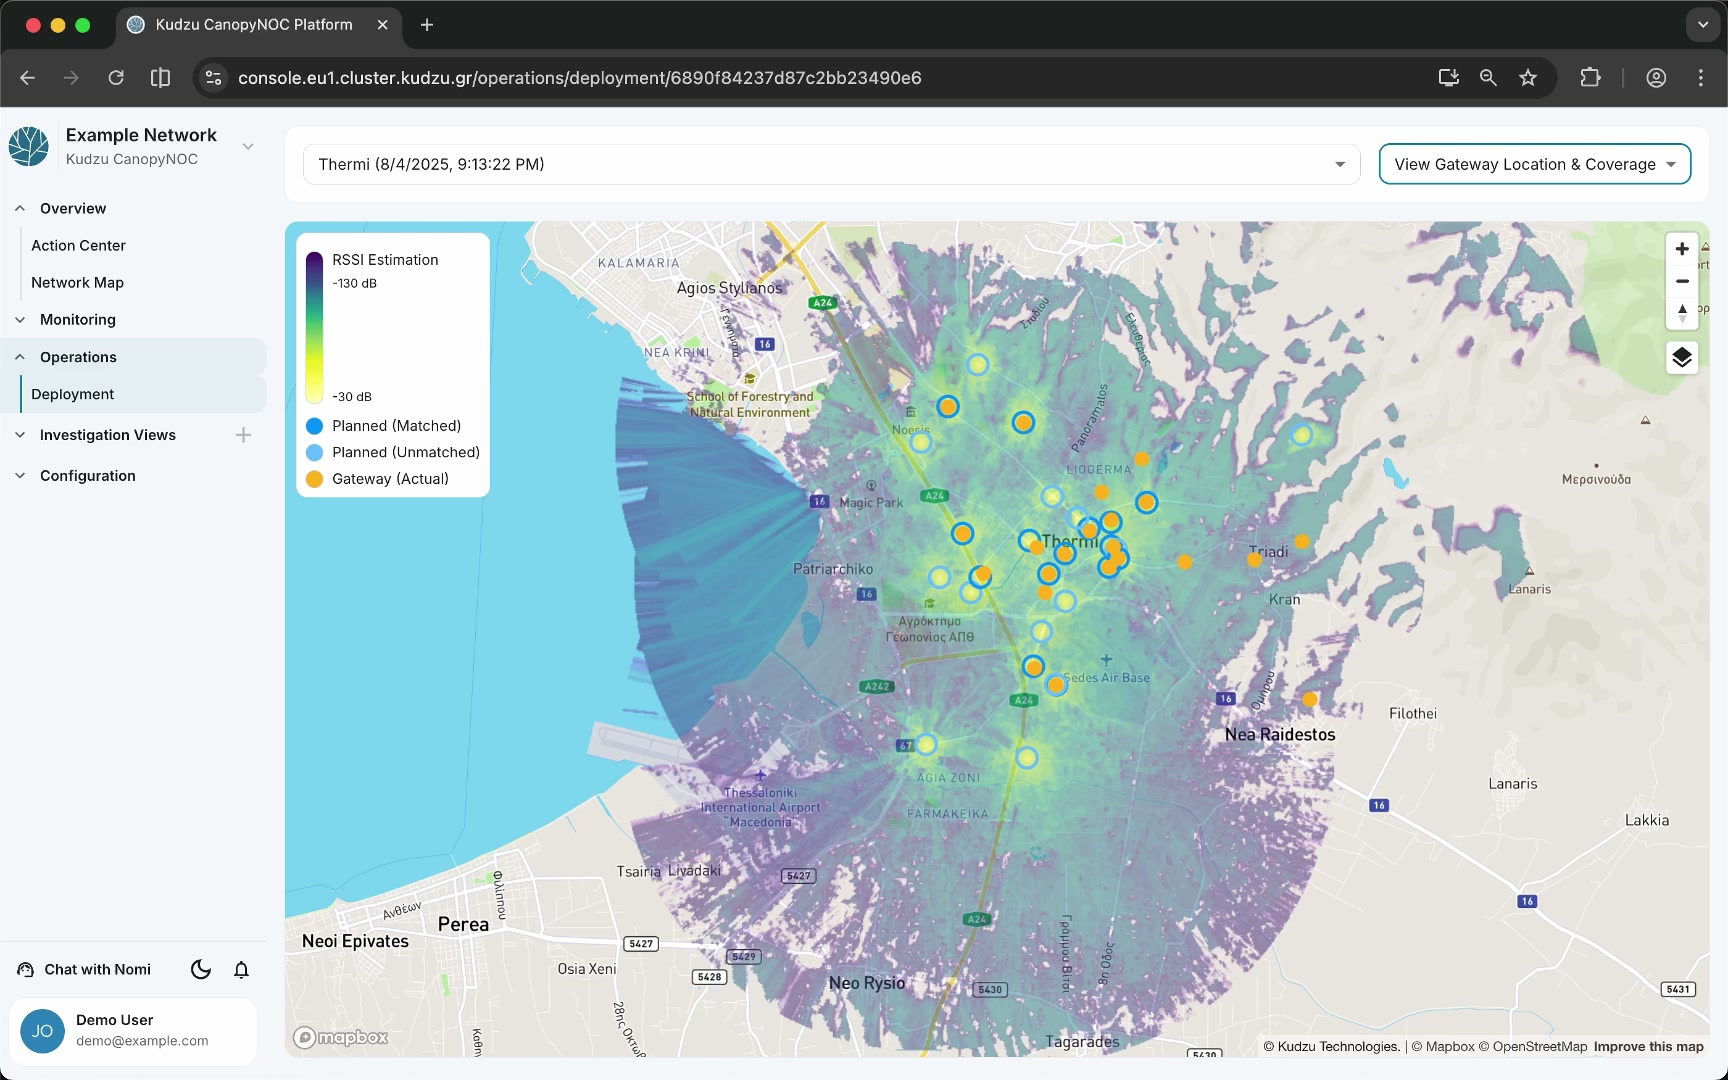
Use this view to identify which planned locations still need field visits.
Step 5 – Use the layers panel#
Click the layers button to open the layers panel for fine-grained control over which data layers are visible. Available layers include:
- Coverage map (simulated RF quality)
- Planned and actual gateway positions
- Device locations
- Deployment validation at coarse and fine resolution
- RSSI maps at different resolutions
- RF path shadowing
The RF path shadowing layer shows a monochrome heat map of locations with high RF absorption, typically caused by buildings or terrain. Use it to investigate signal obstructions in cells that are not meeting coverage expectations.
Step 6 – Track progress to completion#
The deployment is complete when all hexagon cells have turned green, meaning every planned gateway location has been matched by an actual installation. Continue updating cell stages as field work progresses, and periodically switch between presets to verify coverage alignment.
What to do next#
- Once deployment is complete, transition to operational monitoring using the Metrics Dashboard.
- Use the Network Map for ongoing geographic monitoring of your live network.
- Investigate an Alarm if the platform detects issues in newly deployed areas.