Manage Investigation Dashboards
This guide explains how to import, edit, and delete Investigation View dashboards in Canopy NOC. Investigation Views are widget-based diagnostic dashboards that visualize raw network data for ad-hoc analysis.
Before you begin#
- Confirm you have an active Canopy NOC account with at least one network configured.
- Verify that at least one data integration is active so the dashboards have data to display.
Import a dashboard#
Step 1 – Open the management page#
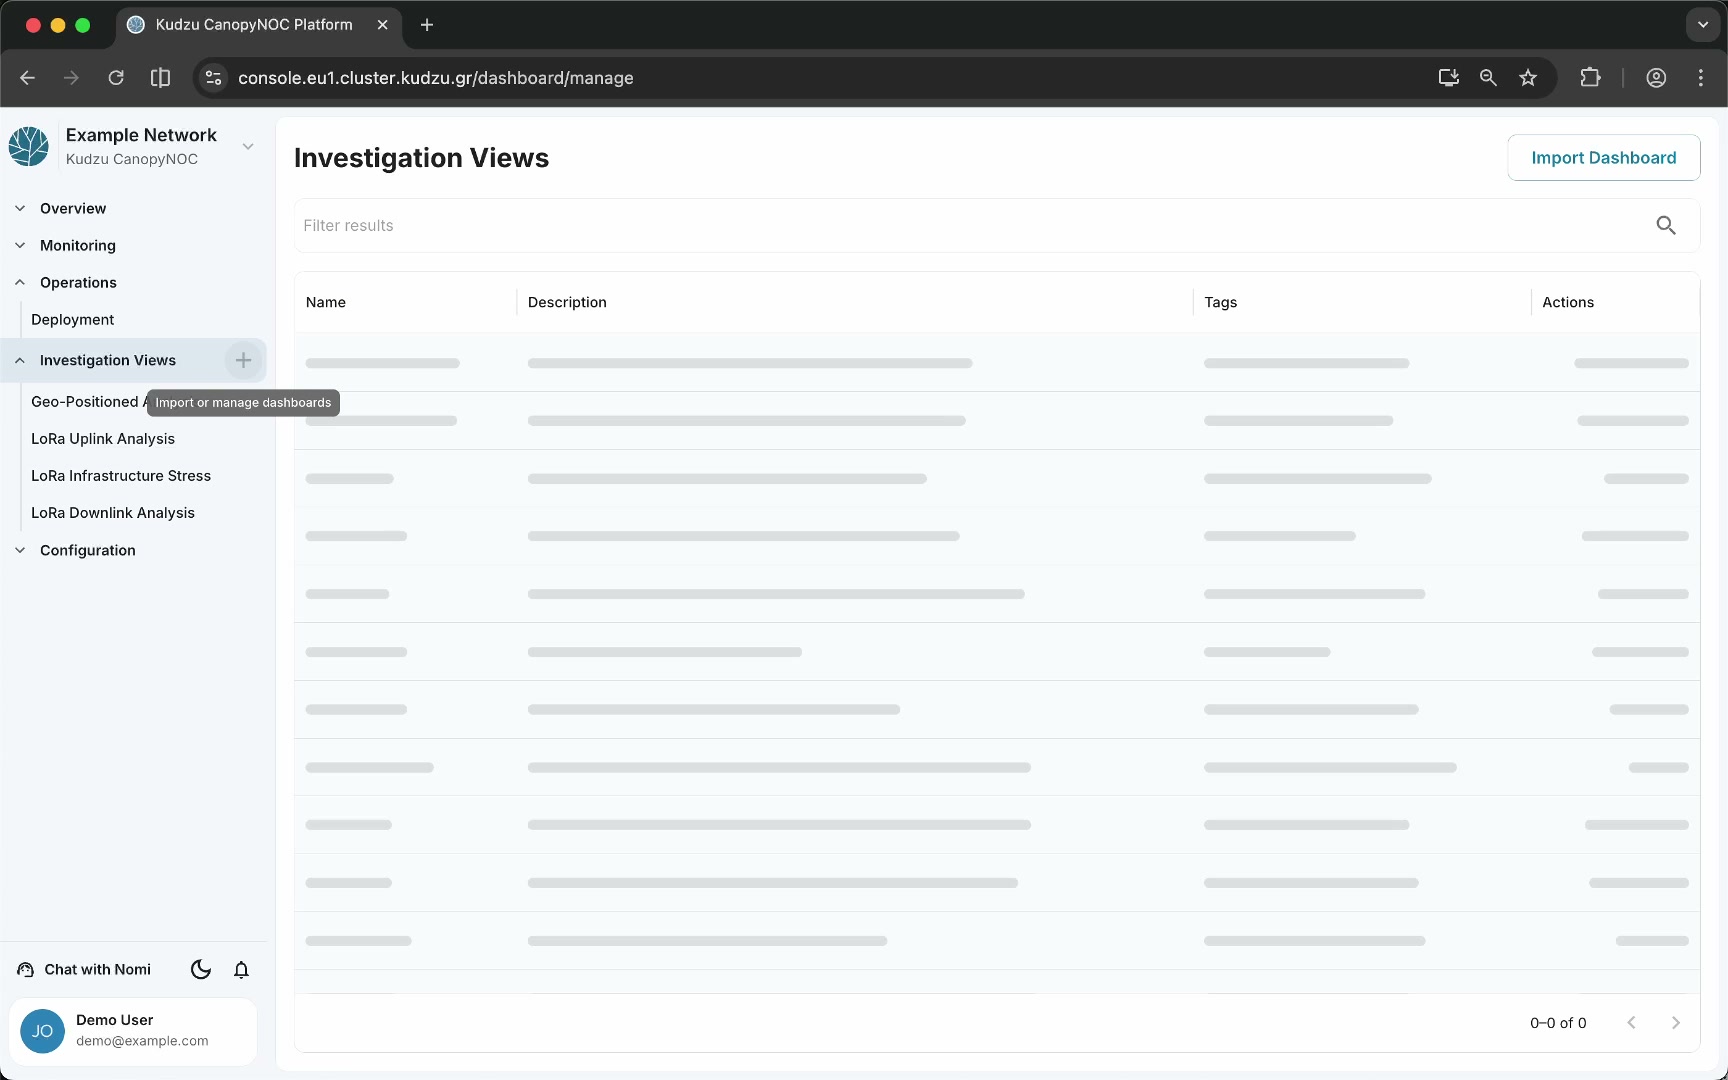
Click the + icon next to the Investigation Views label in the sidebar. This opens the dashboard management page, which shows a table of currently installed views.
Step 2 – Start the import#
Click Import Dashboard in the top-right corner of the management page. A modal dialog opens listing all available dashboard templates.
Step 3 – Select a dashboard#
- Use the Filter results search bar to narrow the list if needed.
- Click the dashboard you want to import.
- Click Select to confirm.
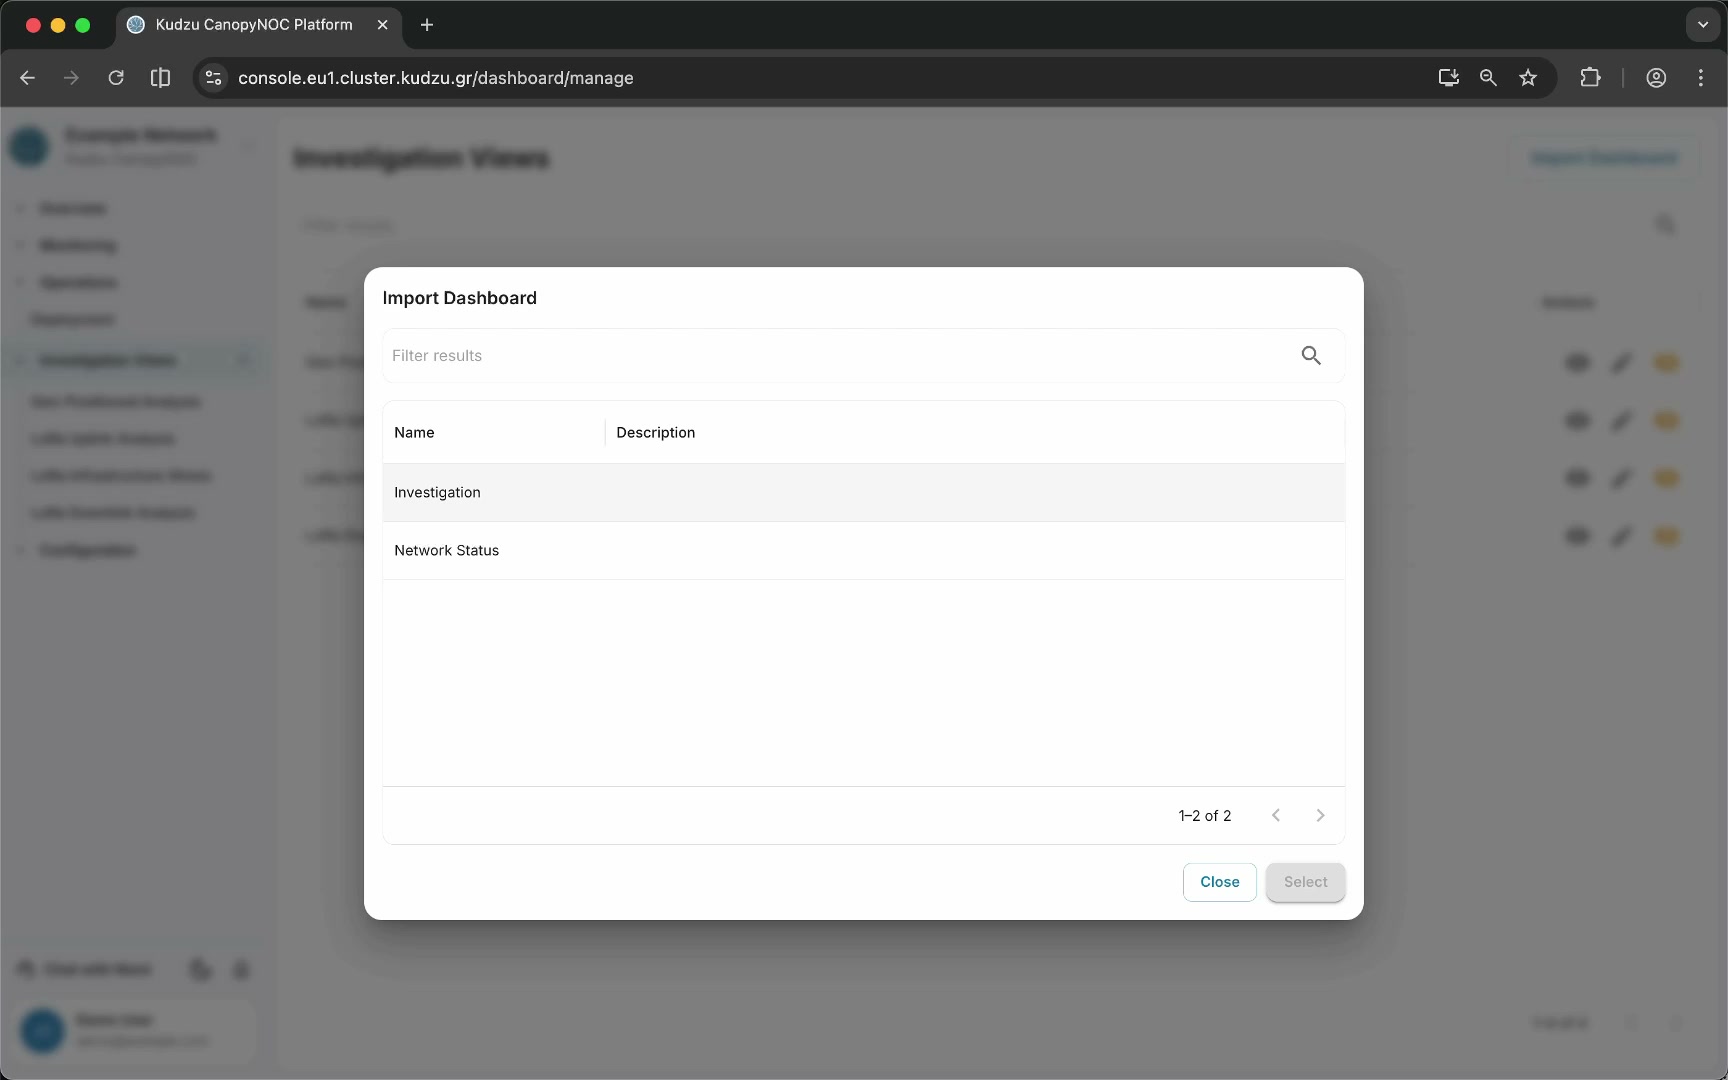
The imported dashboard now appears in both the sidebar navigation and the management table.
The platform provides several predefined dashboards including Geo-Positioned Analysis, LoRa Uplink Analysis, LoRa Infrastructure Stress, and LoRa Downlink Analysis. Import the ones relevant to your diagnostic needs.
Edit a dashboard#
- Open the dashboard management page by clicking the + icon next to Investigation Views in the sidebar.
- In the management table, click the edit (pencil) icon on the dashboard you want to modify.
- Make changes to the dashboard settings and click Save.
Delete a dashboard#
- Open the dashboard management page.
- In the management table, click the delete icon on the dashboard you want to remove.
- Confirm the deletion when prompted.
Deleting a dashboard removes it from the sidebar and the management table. This action cannot be undone. If needed, you can re-import the dashboard from the catalog.
What to do next#
- Open an imported dashboard from the sidebar under Investigation Views and use the time window and traffic source filters to explore your data.
- Review the Investigation Views reference for details on chart types, filters, and widget controls.
- Investigate an Alarm to use dashboards alongside alarm-driven analysis.