Investigate an Alarm
This guide walks you through the process of drilling into an alarm in Canopy NOC, reviewing its history, and launching an AI-assisted investigation to identify the root cause.
Before you begin#
- Confirm you have an active Canopy NOC account with at least one monitored network.
- Verify that the network has active alarms to investigate. The sidebar badge next to Alarms shows the total count of active alarms.
Step 1 – Open the Alarms overview#
Navigate to Monitoring > Alarms in the sidebar. The overview page displays:
- Category tiles at the top, grouped by problem taxonomy (Coverage and RF Quality, Quality of Service, Infrastructure and Connectivity, etc.). Each tile shows the count of active alarms and a severity progress bar.
- Alarm list table below, showing individual alarms with severity, description, category, timestamps, and status.
Step 2 – Drill into a category#
Click a category tile to see its subcategories and a filtered alarm list. A mini-map on the right shows geographic features associated with alarms in that category. Continue clicking subcategory tiles to narrow your focus.
Step 3 – Open the alarm detail#
Click any alarm description link in the list table. This opens the metric-level alarm detail page, which contains:
- A historical chart of the metric value with alarm lifecycle markers indicating when the alarm was raised, escalated, de-escalated, or resolved.
- A map panel showing geographic features associated with the metric.
- An alarm history table listing every state transition with timestamps and severity levels.
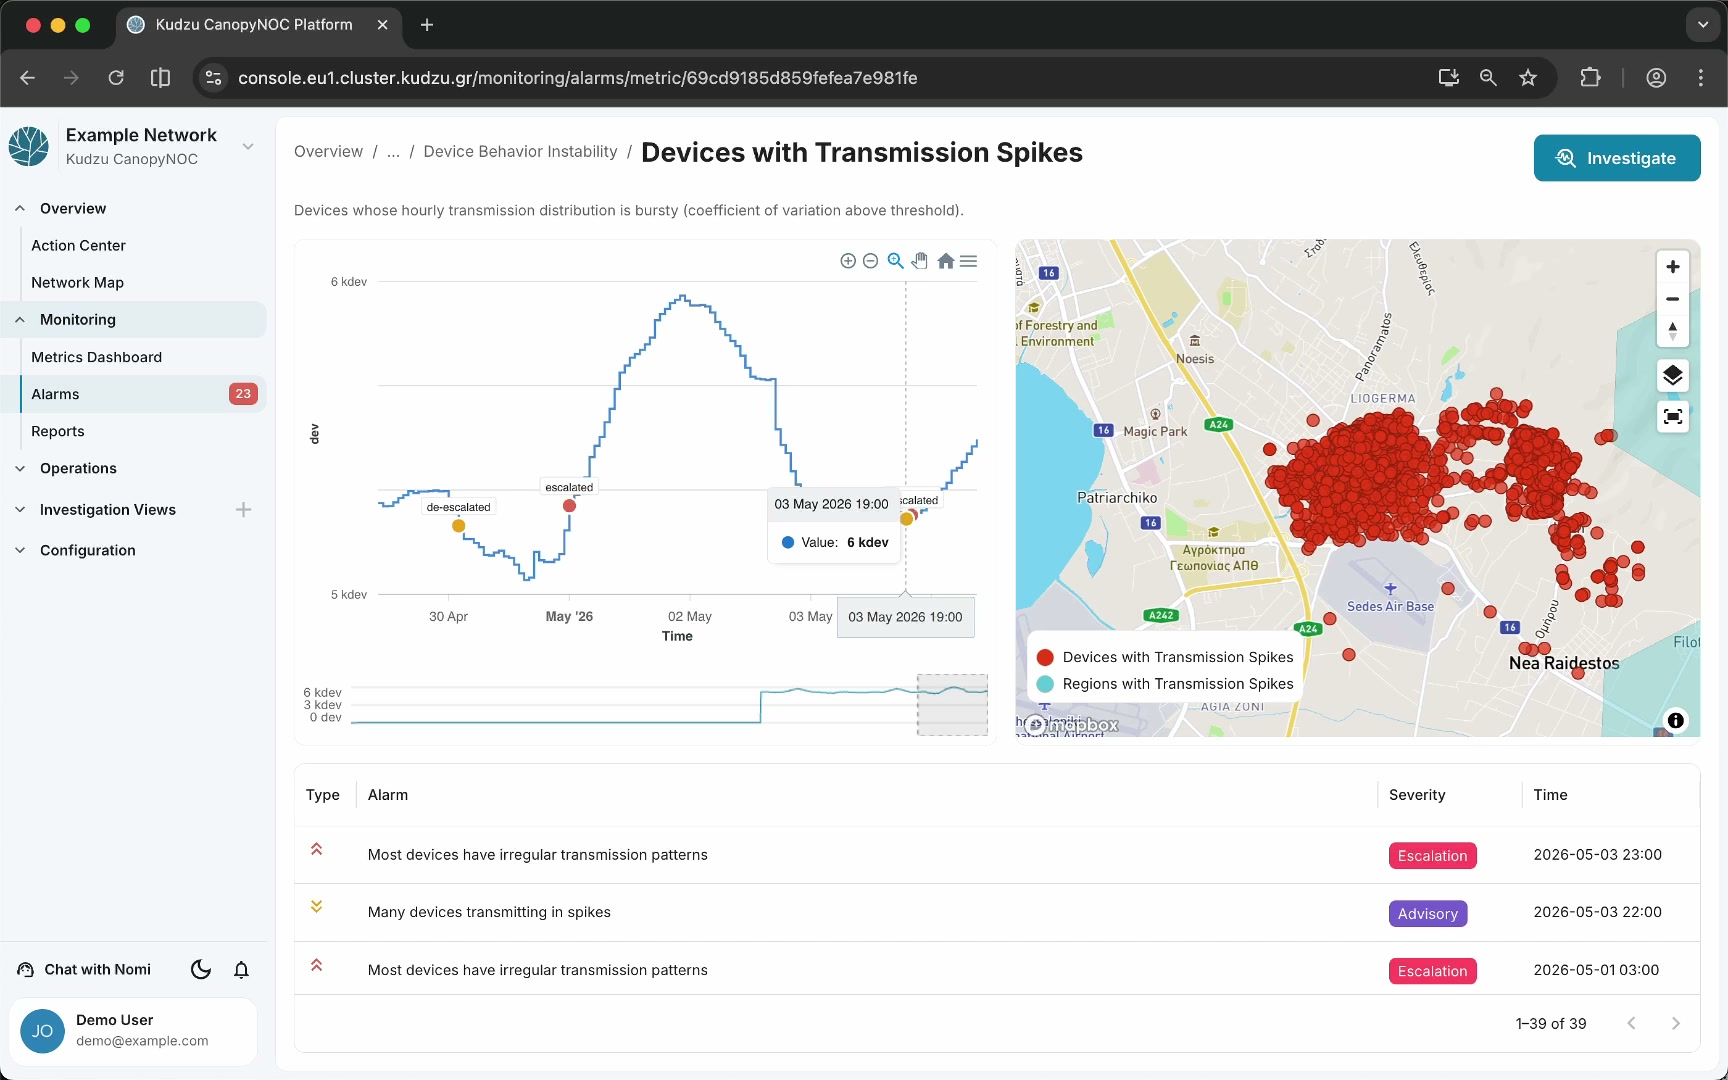
Hover over the markers on the chart to see exact timestamps and metric values at each alarm state change.
Step 4 – Review the alarm history#
Scroll down to the alarm history table below the chart. This table shows the complete event log for the metric, including every escalation and de-escalation, sorted by most recent event first. Use this to understand how the alarm evolved over time.
Step 5 – Launch an AI investigation#
Click the Investigate button in the top-right corner of the alarm detail page. This opens the Nomi AI chatbot pre-loaded with full context about the alarm: the metric, its history, affected entities, and current firing state.
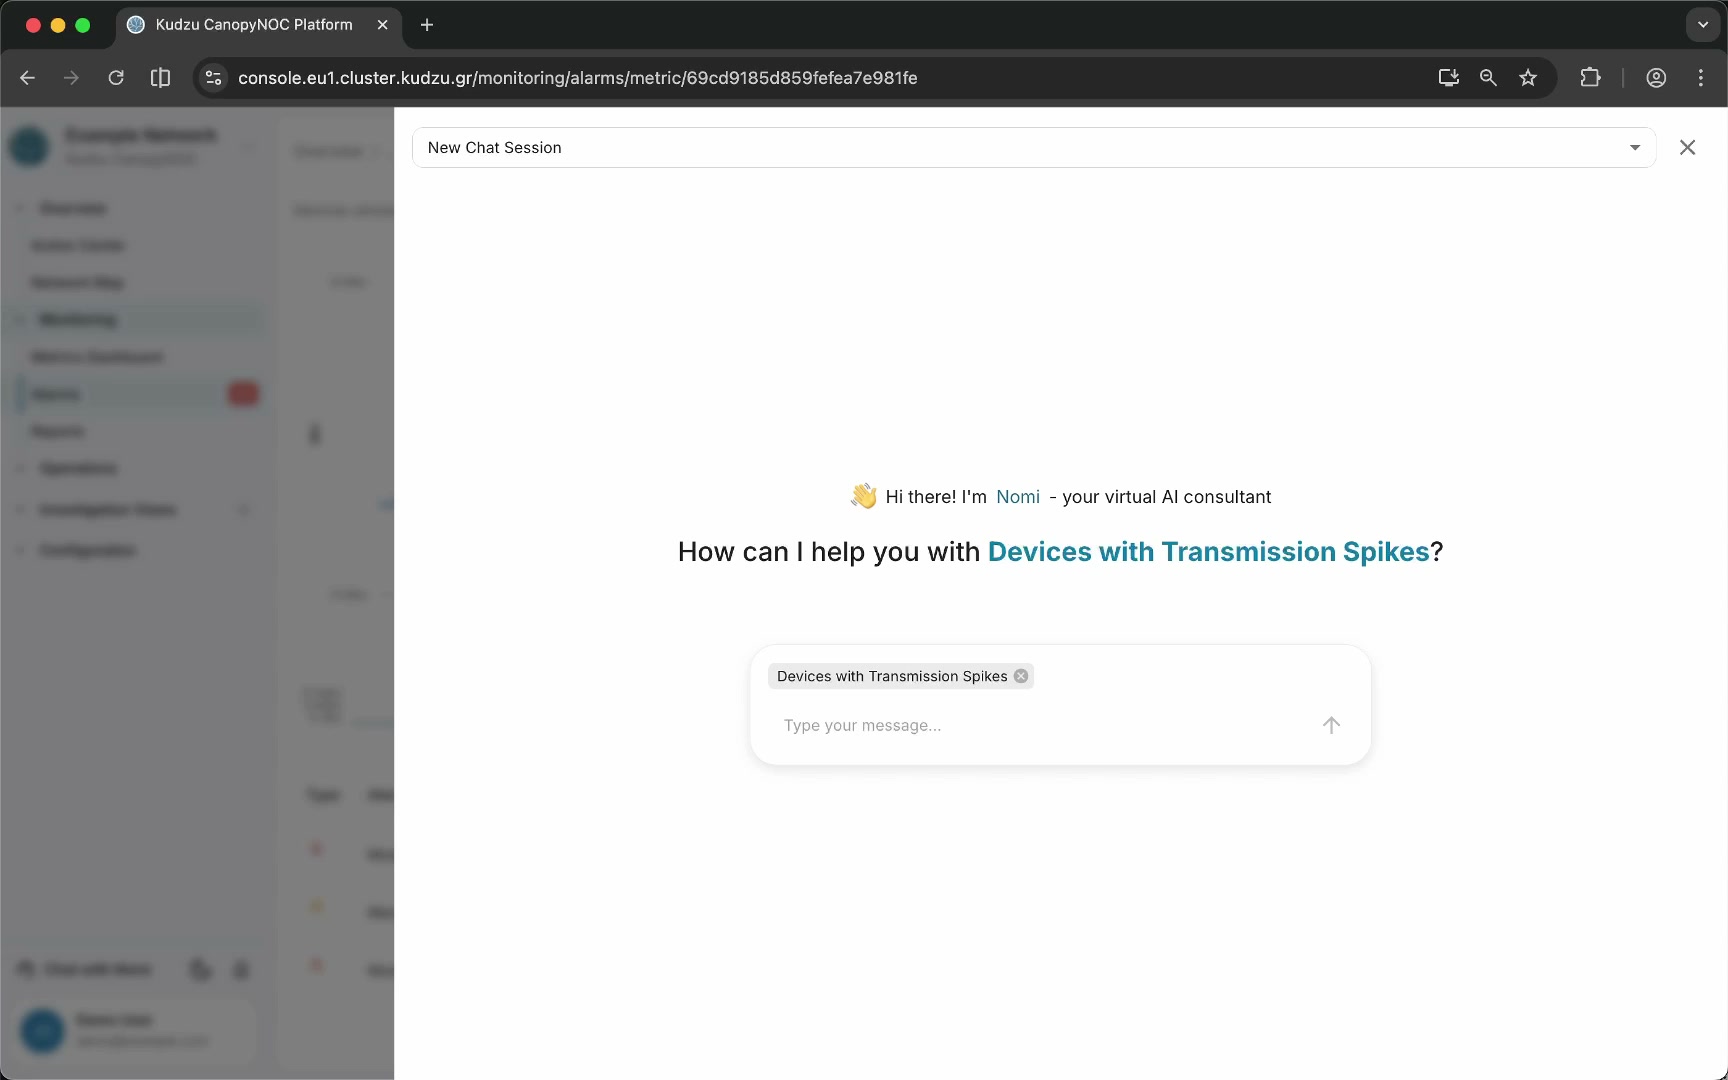
Nomi guides you through an interactive debugging process to identify the root cause. You can ask follow-up questions, request deeper analysis, and save investigation reports for your team.
What to do next#
- Use the breadcrumb bar at the top of the alarm detail page to navigate back to the overview or any parent category.
- Open the Metrics Dashboard to see the same metric in its KPI context.
- Review Investigation Views dashboards for raw data that may explain the alarm trigger.