Onboard Your Network
This tutorial walks you through the complete onboarding process for a new network in Kudzu Canopy NOC. By the end, your LNS is connected, devices and gateways are imported, investigation dashboards are ready, and network monitoring is active.
The example below uses The Things Stack as the LoRaWAN Network Server. The same flow applies to other supported LNS types — only the external API key creation steps differ.
Before you begin#
Make sure you have the following:
- A Kudzu Canopy NOC account. If you do not have one yet, see Sign Up.
- A LoRaWAN Network Server account (this guide uses The Things Stack).
- Devices and gateways already registered on your LNS.
Steps#
1. Review the onboarding checklist#
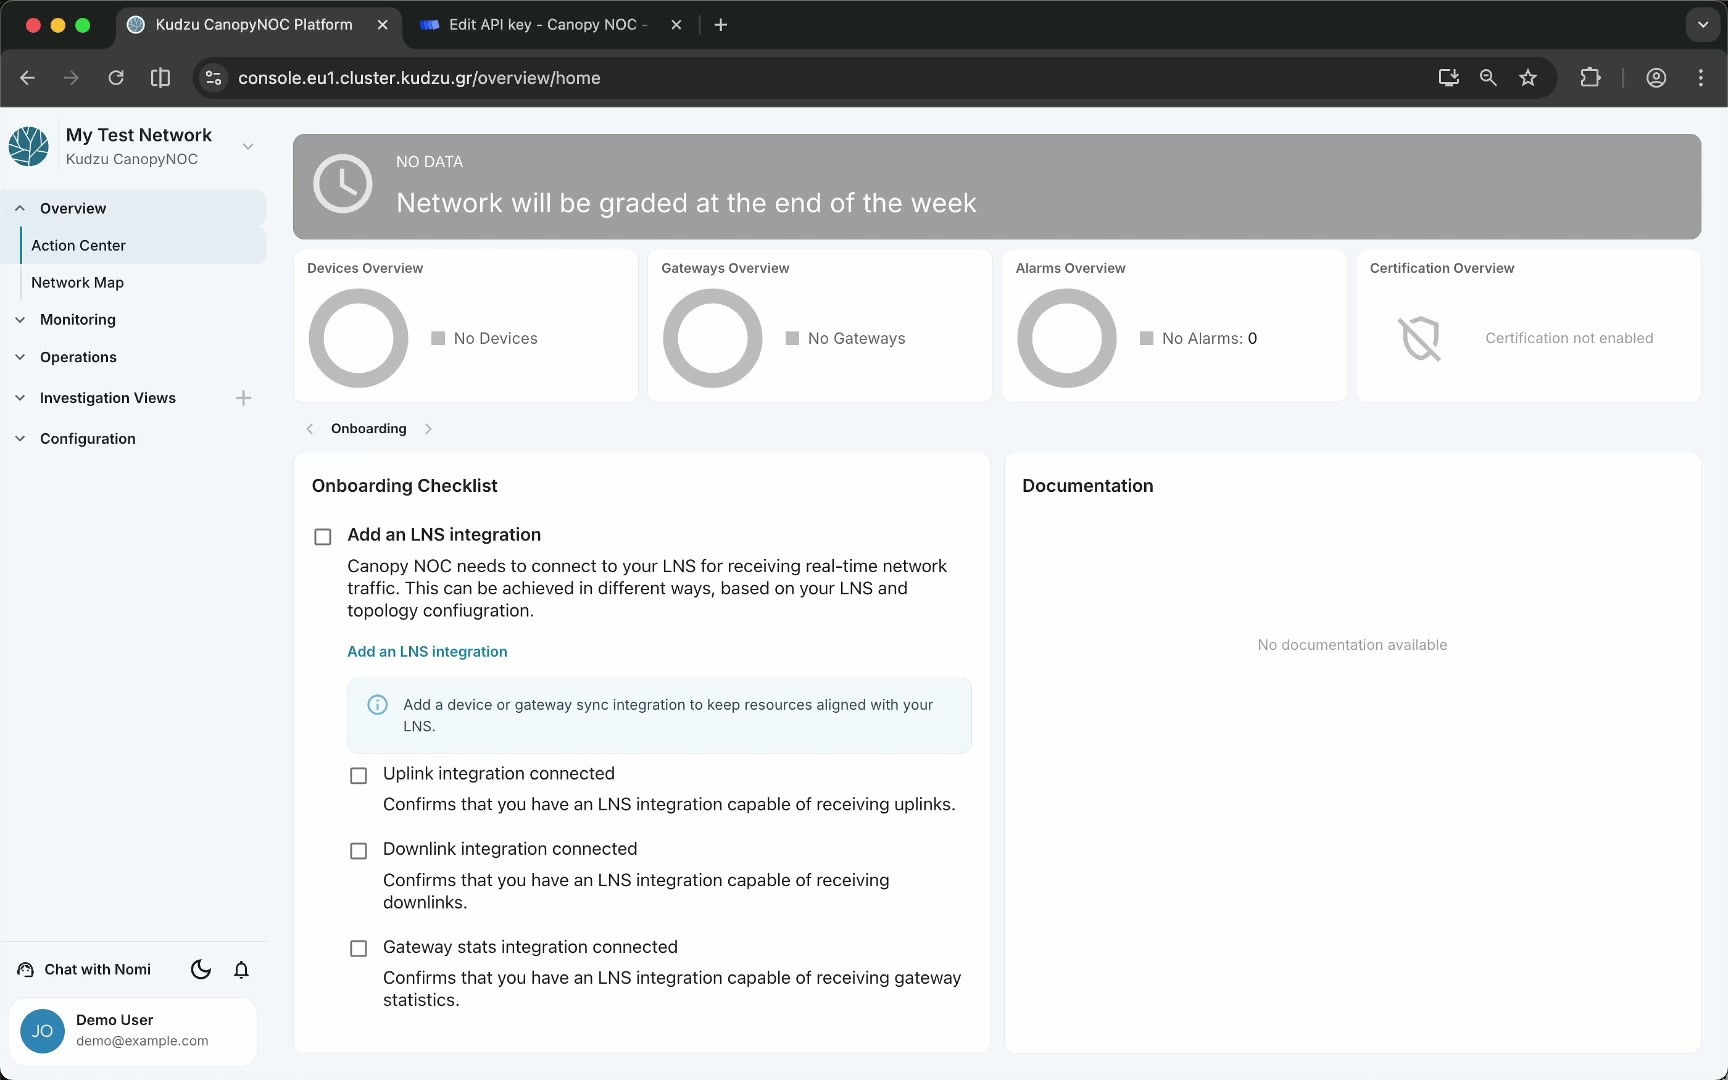
After logging in, open the Action Center. The network status area is grayed out with the message “No data — Network will be graded at the end of the week.” Below the overview widgets, the onboarding checklist lists every item you need to complete before the network becomes operational.
2. Add an LNS integration#
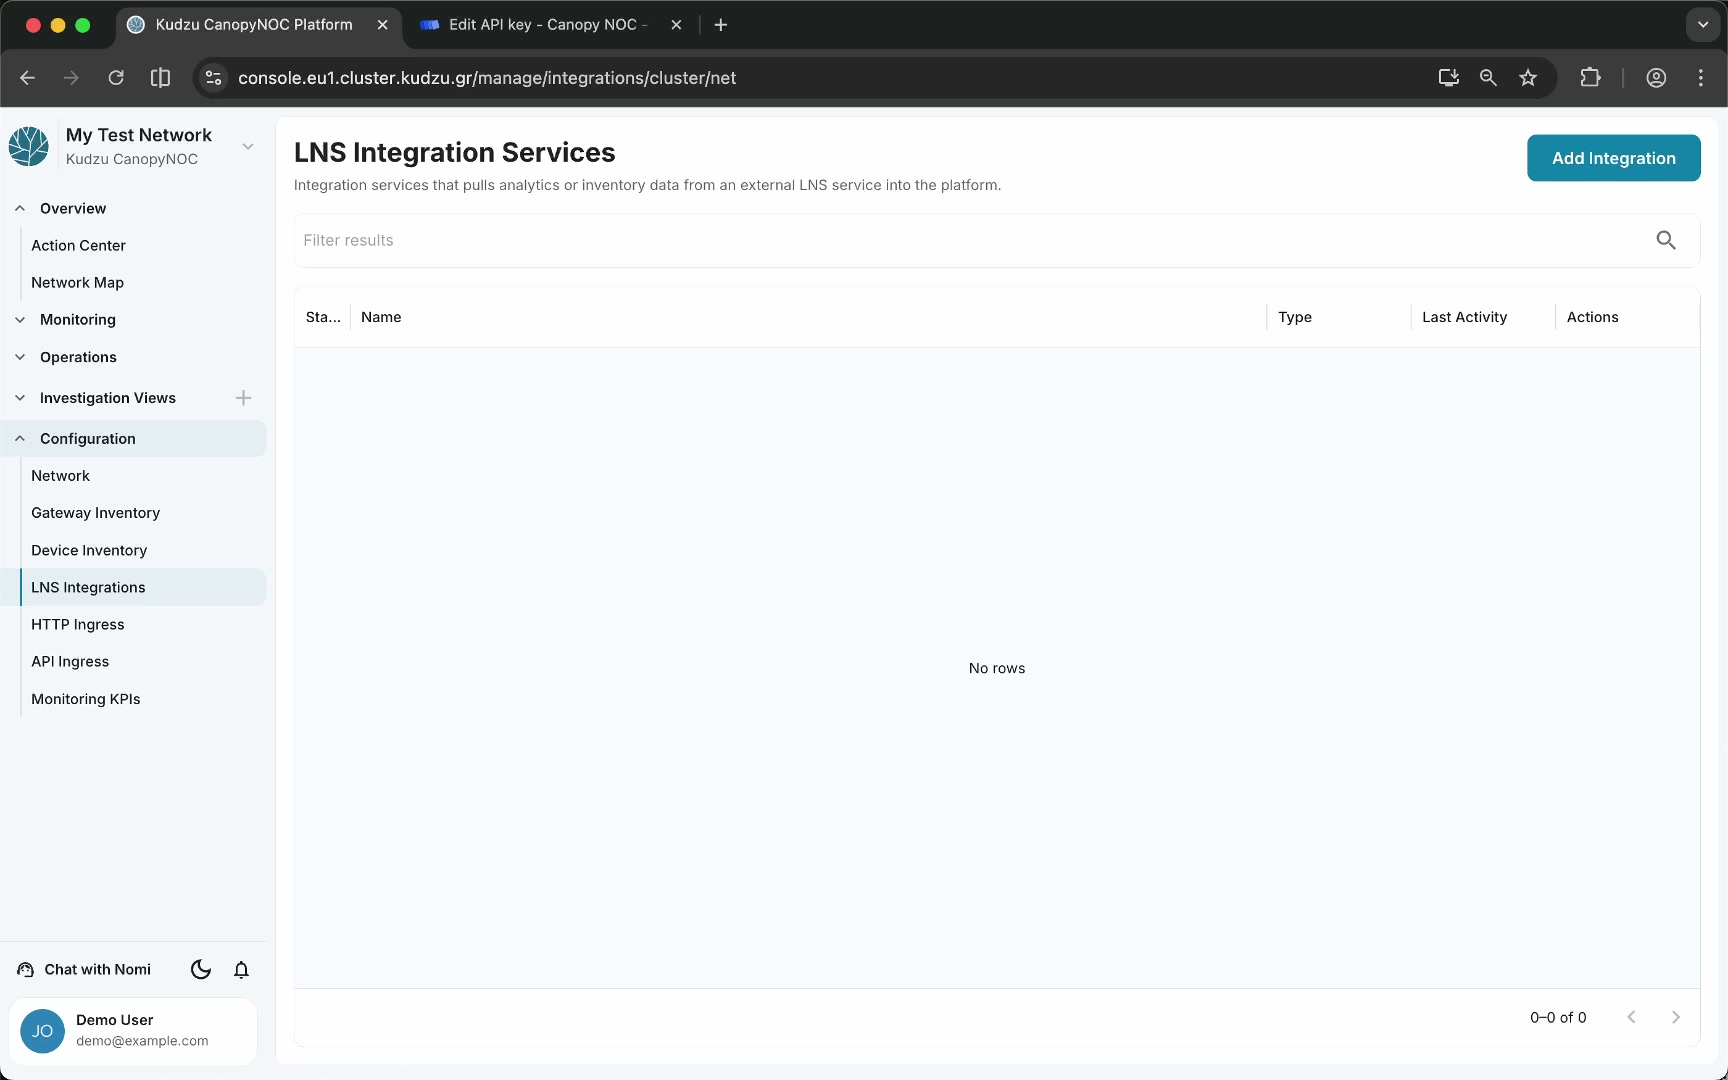
Click Add LNS integration on the onboarding checklist, or navigate to Configuration > LNS Integrations in the sidebar.
- Click Add Integration.
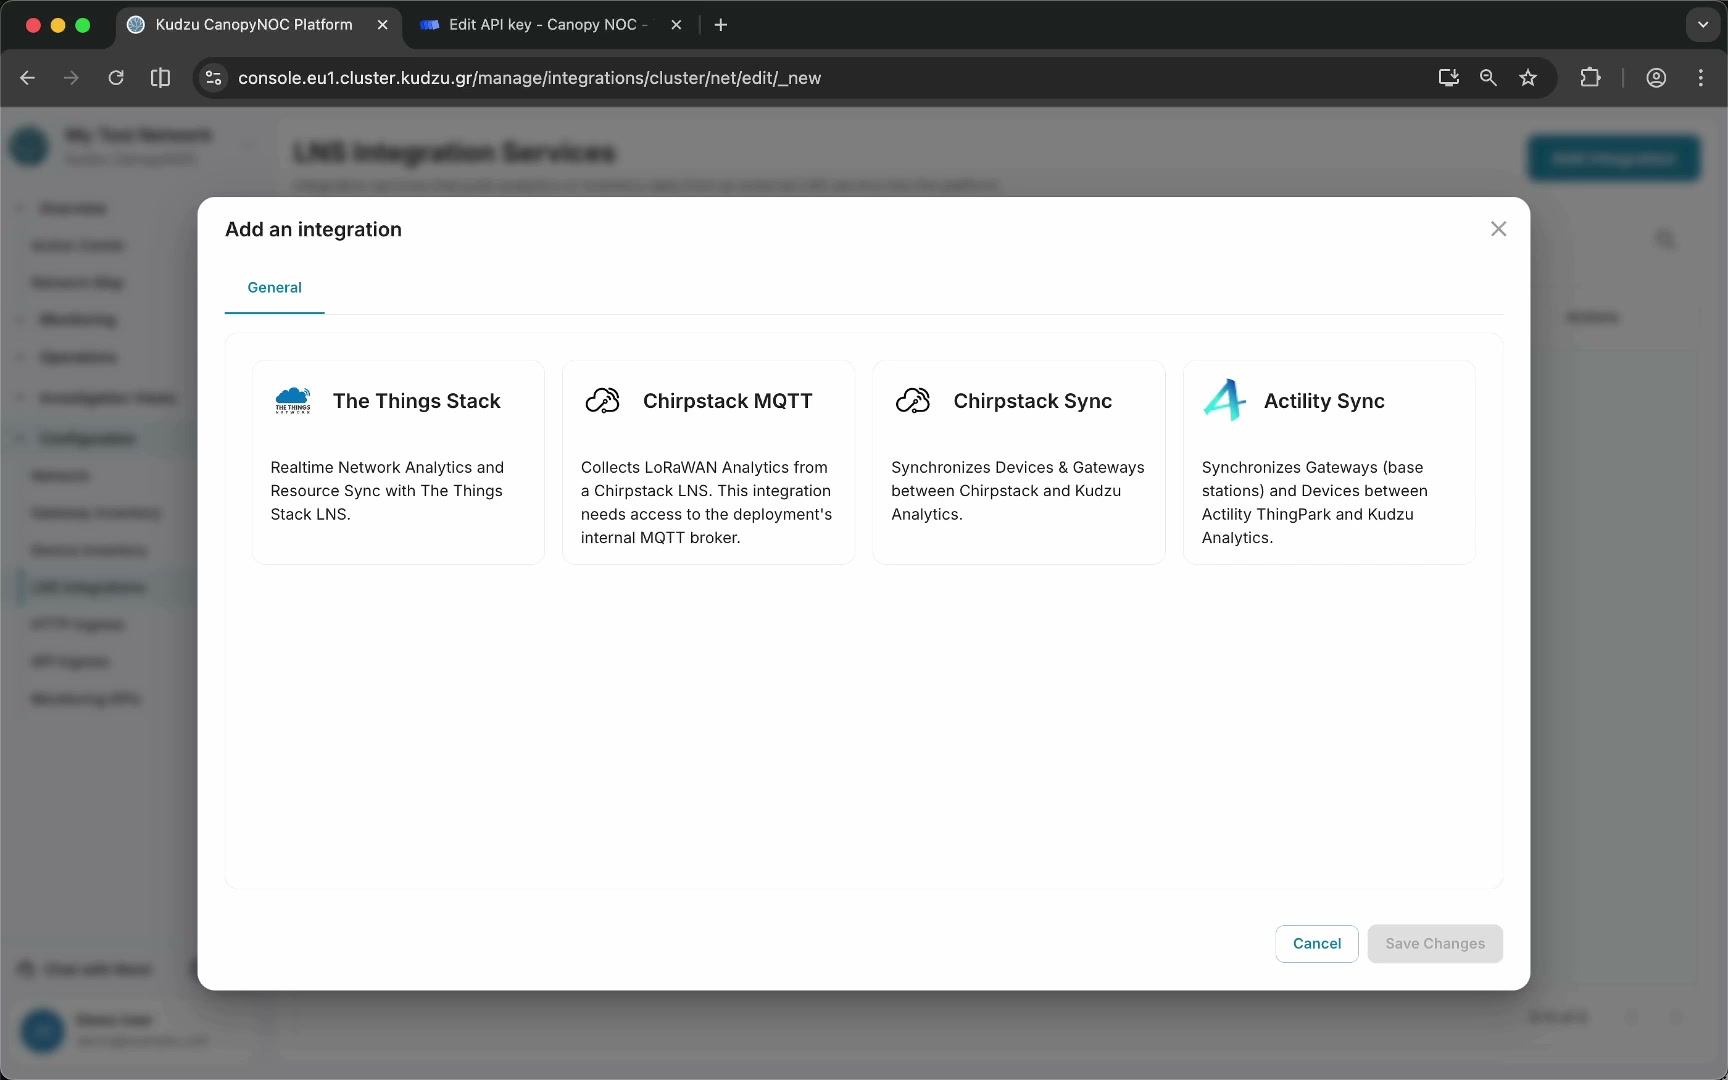
- Select the integration type that matches your LNS (e.g., The Things Stack).
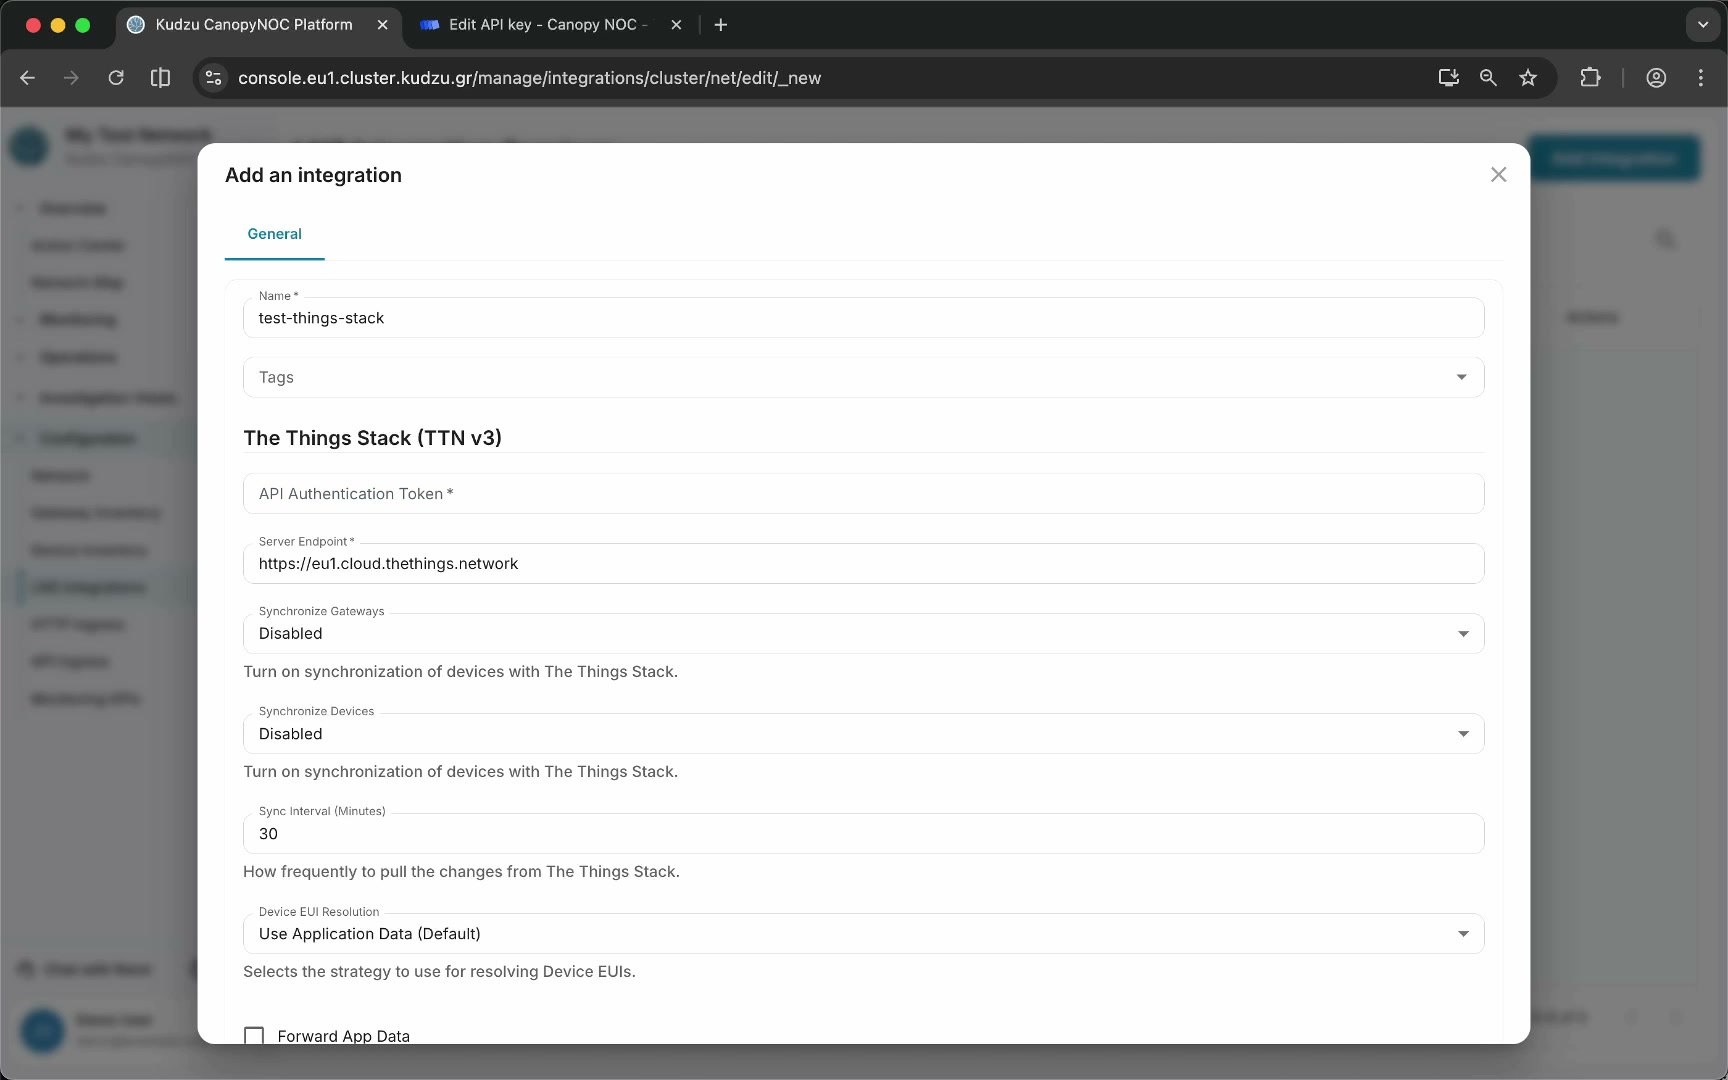
- Enter a display name for the integration.
- Leave the Authentication token field empty for now — you will create an API key on The Things Stack in the next step.
3. Create an API key on The Things Stack#
Switch to The Things Stack management console to generate an API key for Canopy NOC.
- Open The Things Stack console.
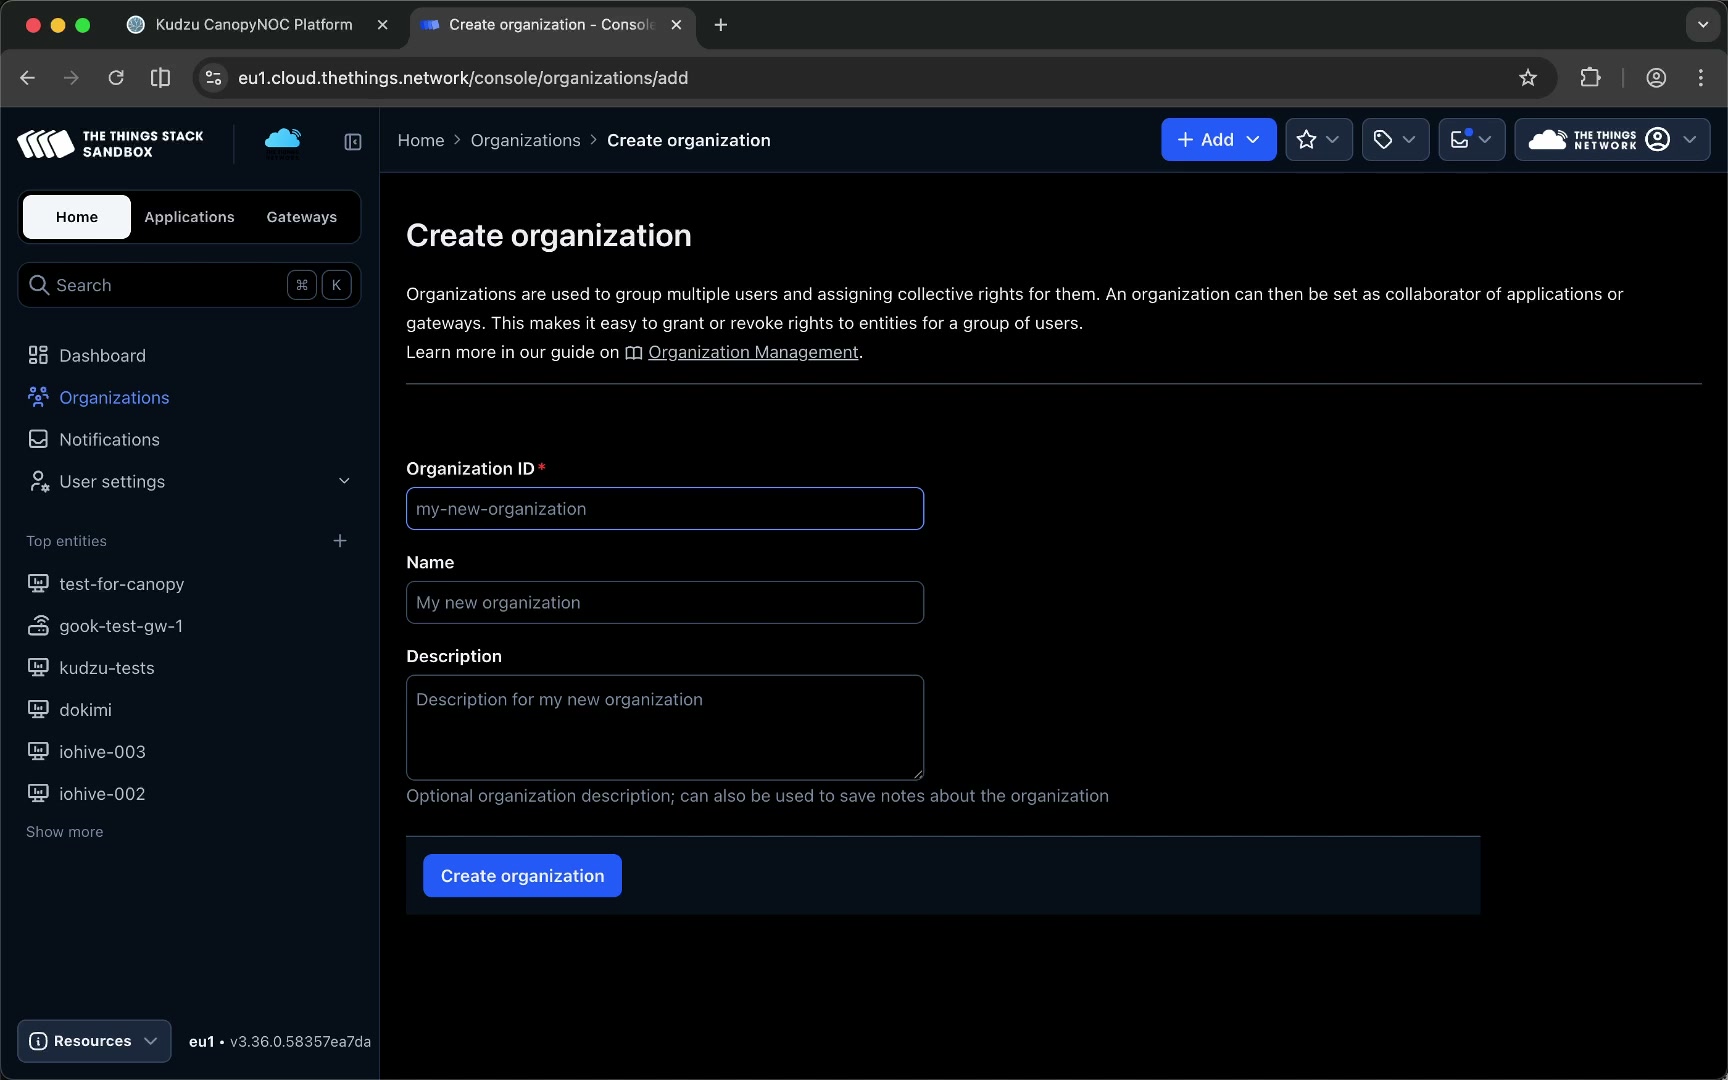
- Go to Organizations and click Create new organization.
- Give the organization a name (e.g.,
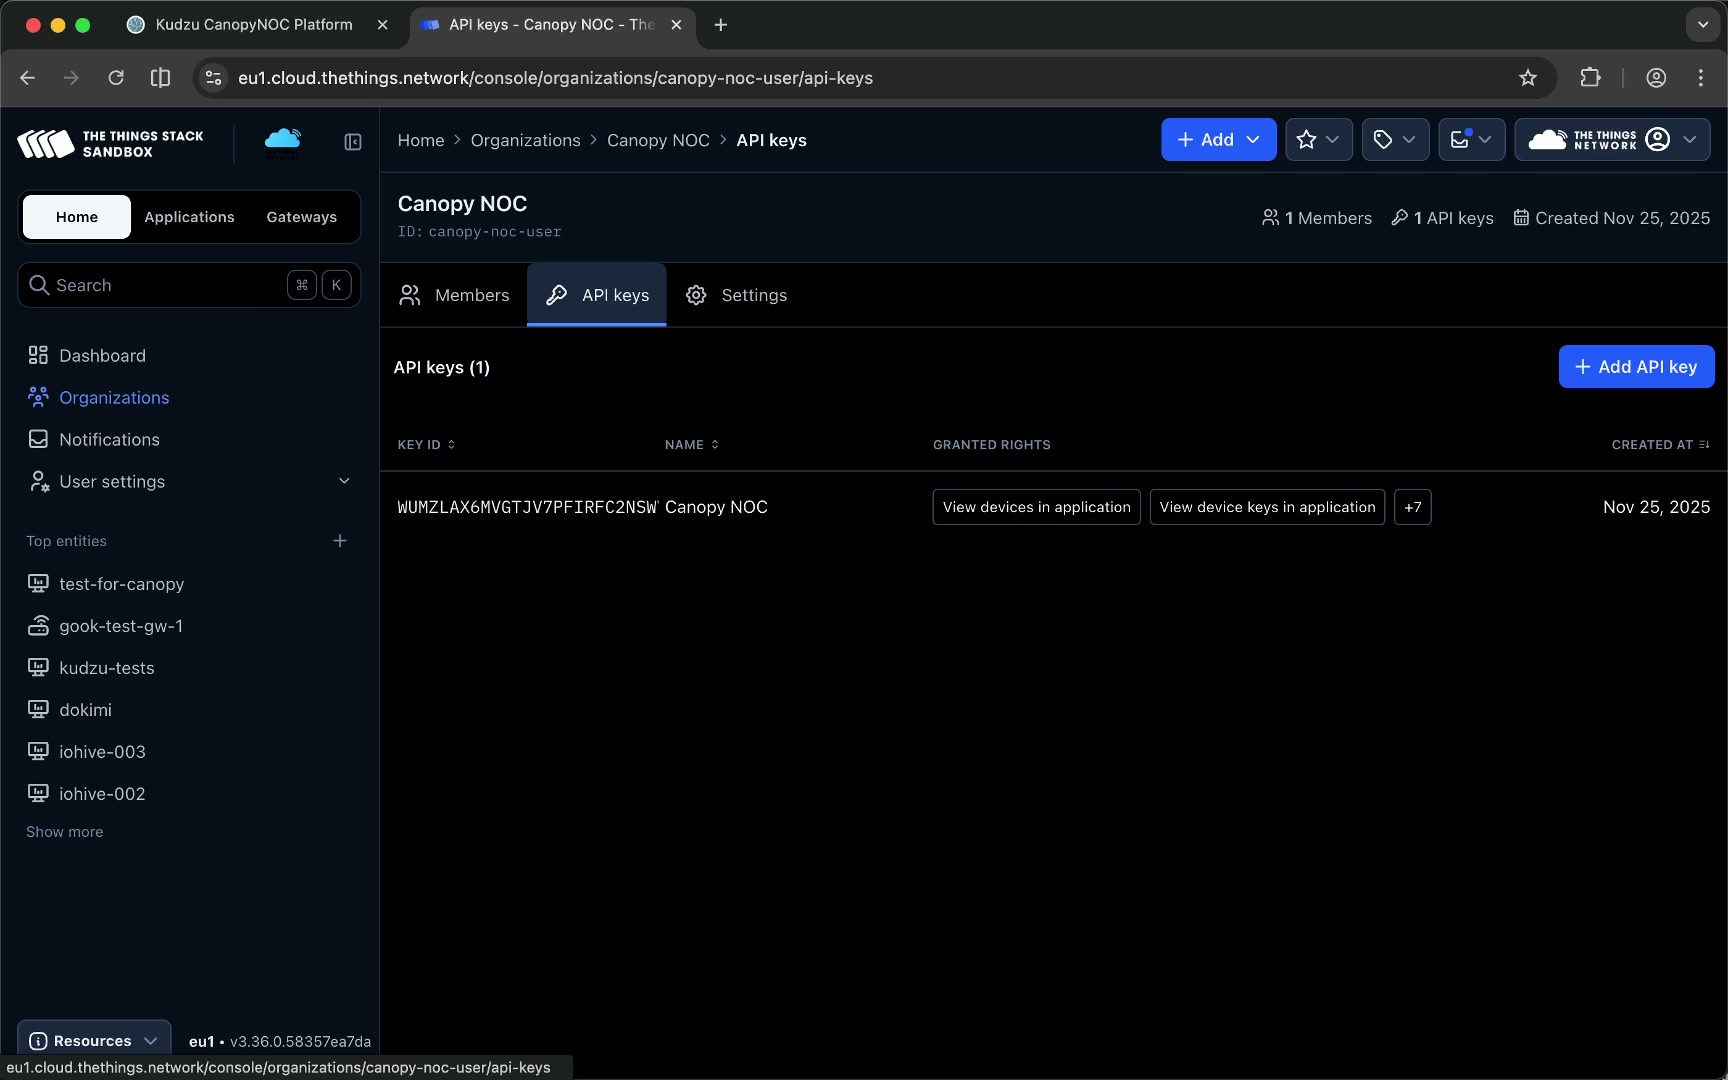
canopy-noc-user). - Once the organization is created, navigate to API keys.
- Click Add API key. Do not set an expiry date.
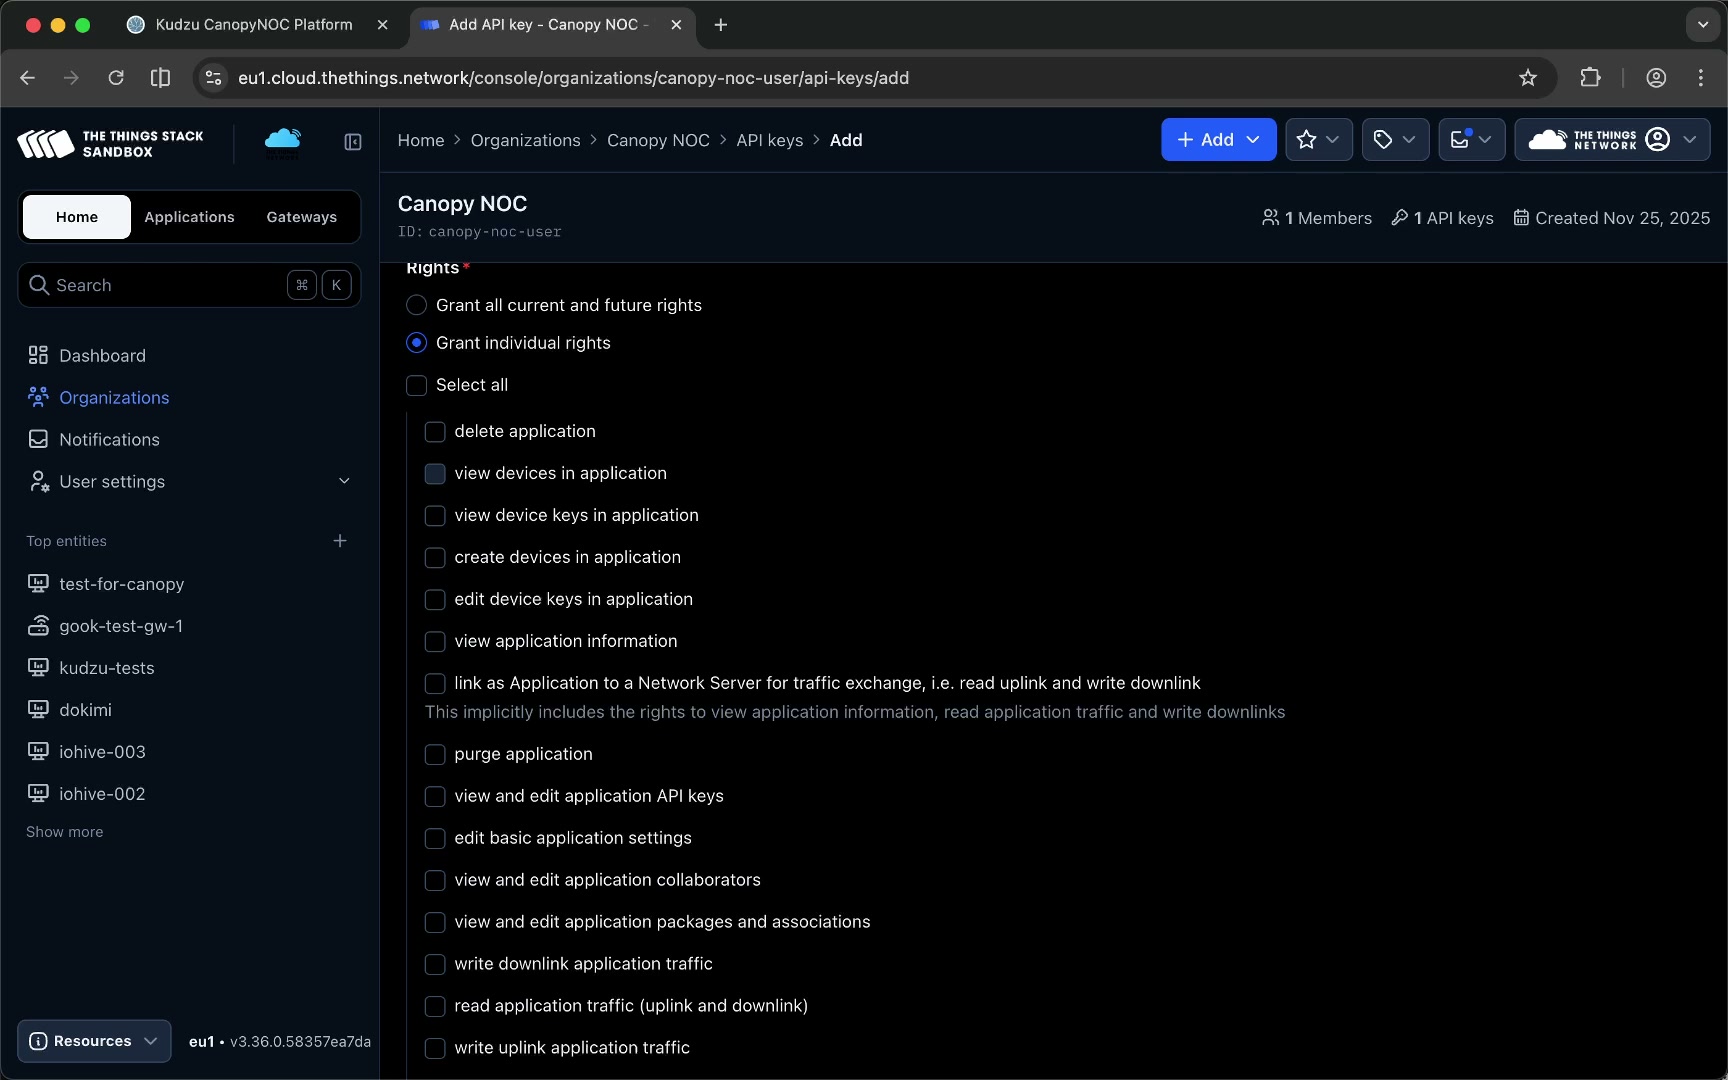
- Select Grant individual rights and enable the following permissions:
- View devices and applications
- View device keys and applications
- View application information
- Read application traffic
- View gateway information
- View gateway location
- View gateway status
- Read gateway traffic
- List the applications the organization is collaborator of
- List the gateways the organization is collaborator of
- View organization information
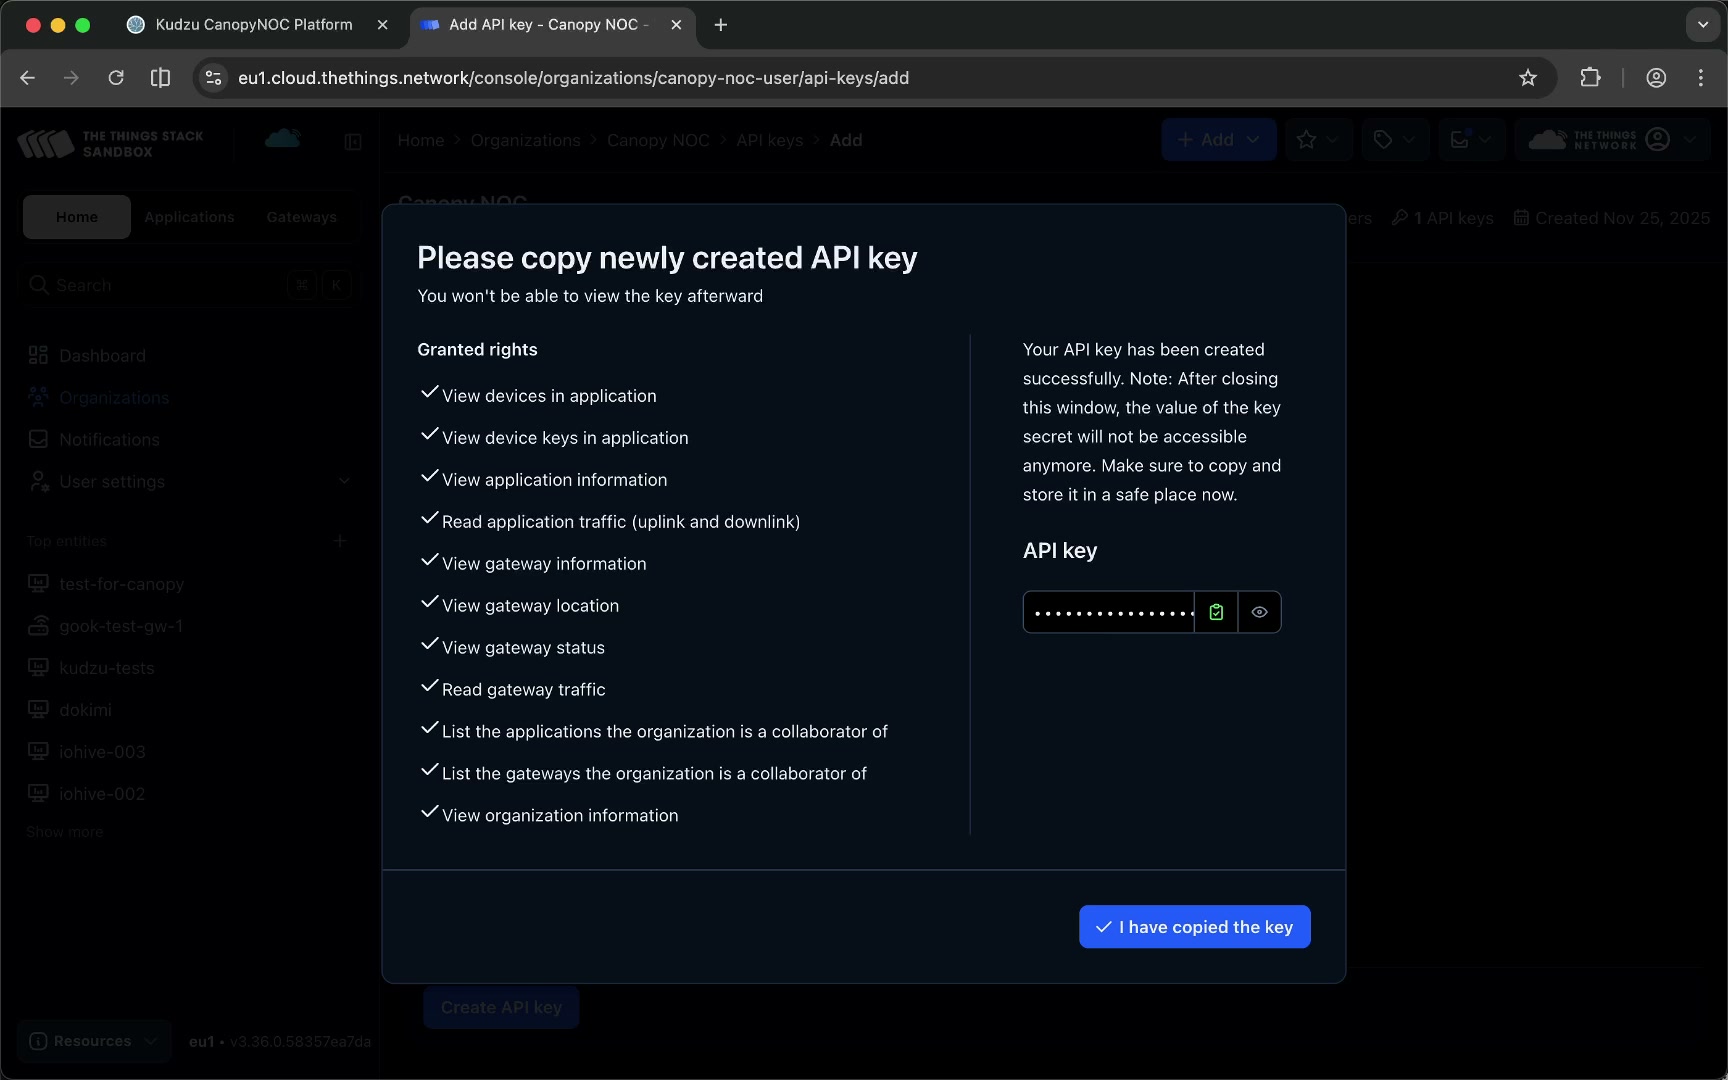
- Click Create API key.
- Copy the generated API key immediately.
The API key is shown only once. Copy it before closing the dialog — it cannot be retrieved later.
4. Complete the LNS integration in Canopy NOC#
Return to the Canopy NOC integration form.
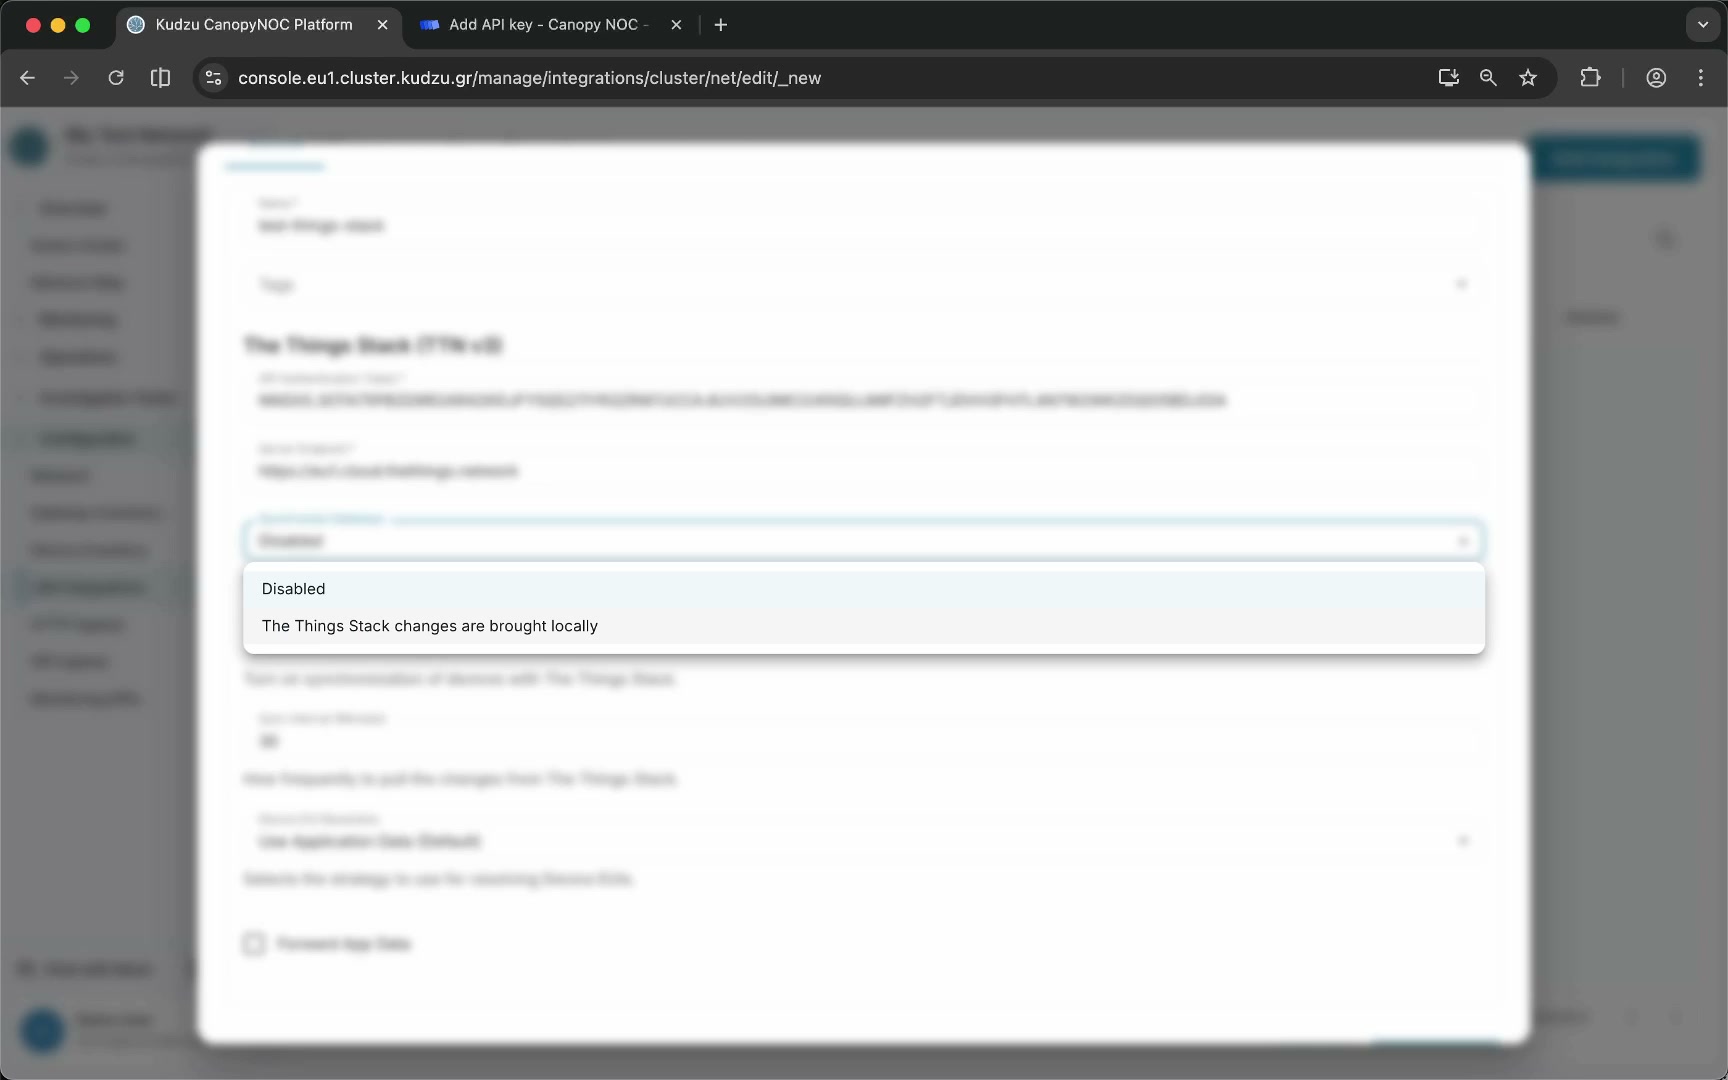
- Paste the copied API key into the Authentication token field.
- Enable Synchronize gateways to automatically import gateway records from The Things Stack.
- Enable Synchronize devices to automatically import device records from The Things Stack.
- Click Save Changes.
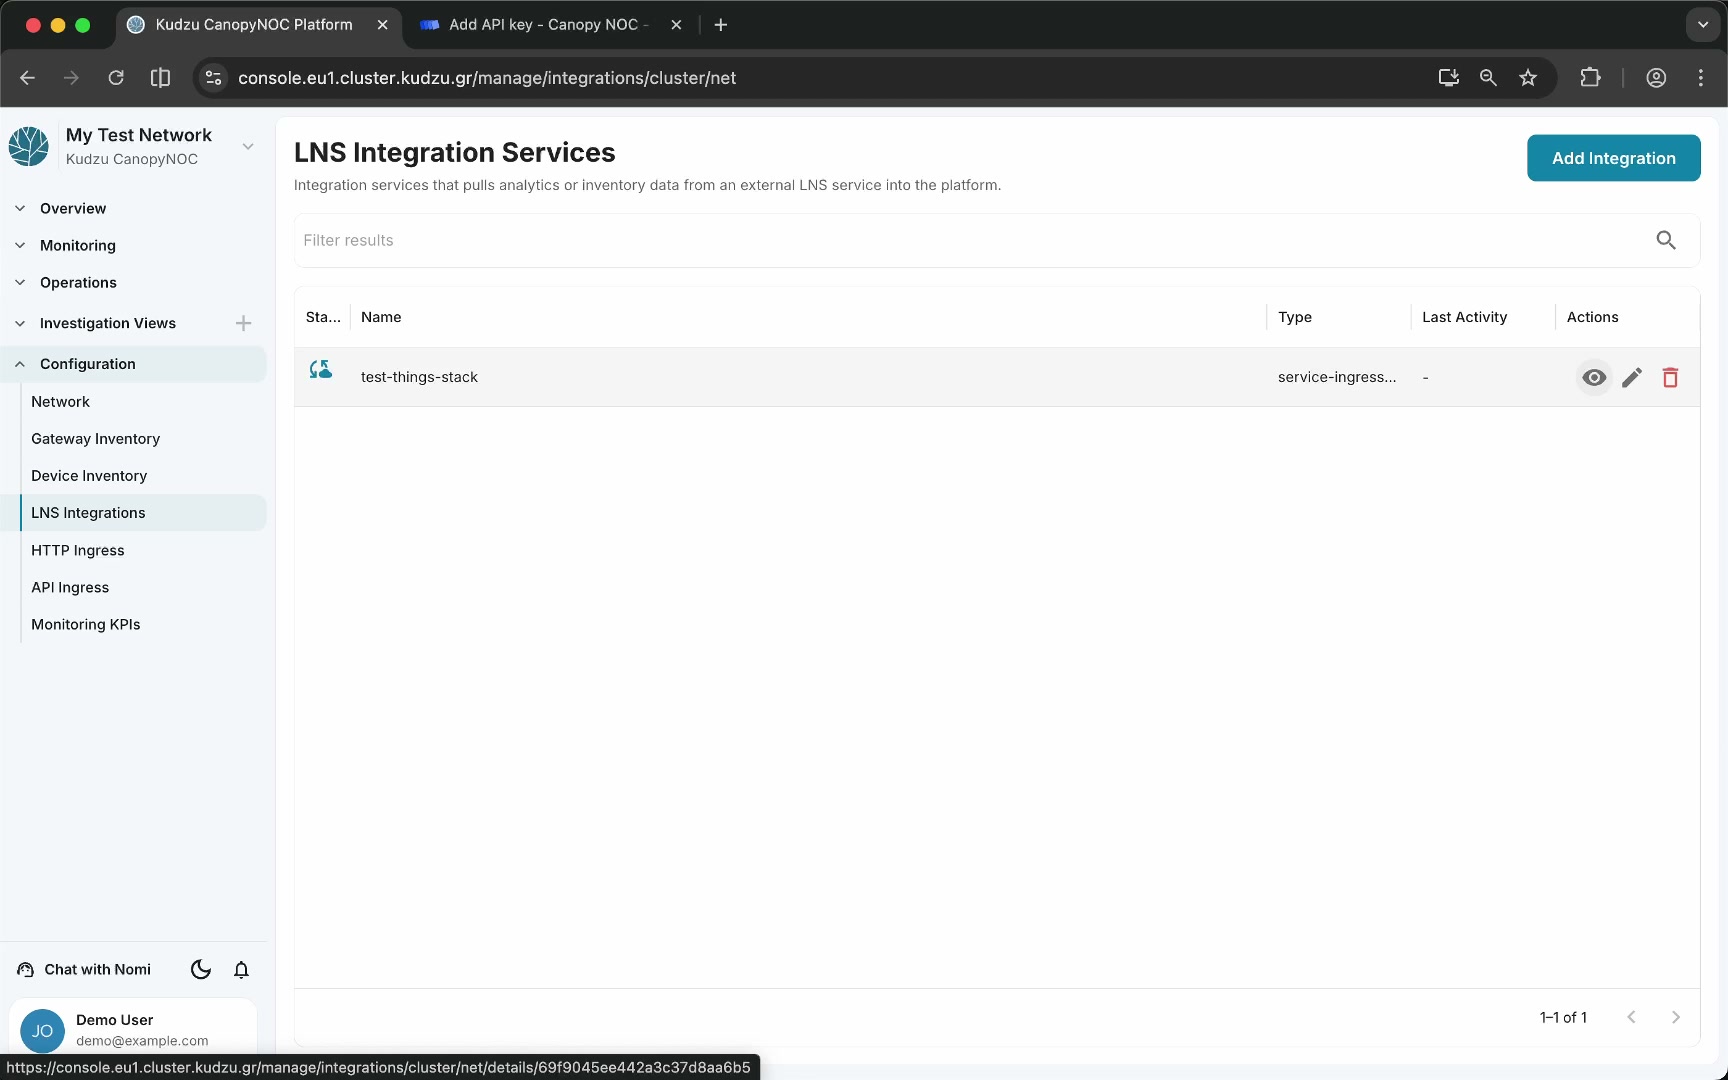
The new integration appears in the integration list within seconds.
5. Verify the integration#
- Click the eye icon on the newly created integration to open the diagnostic view.
- Check the Metrics and Logs tabs to verify that the connection is working and data is flowing.
If the integration shows errors, double-check that the API key has all required permissions and that the organization is a collaborator on your applications and gateways in The Things Stack.
6. Confirm devices and gateways are imported#
Navigate back to the Action Center. With synchronization enabled, two onboarding checklist items are now automatically checked:
- Add LNS integration — complete
- Add your network devices and gateways — complete
Verify the imports by navigating to:
- Configuration > Gateway Inventory — the synchronized gateways appear in the list.
- Configuration > Device Inventory — the synchronized devices appear in the list.
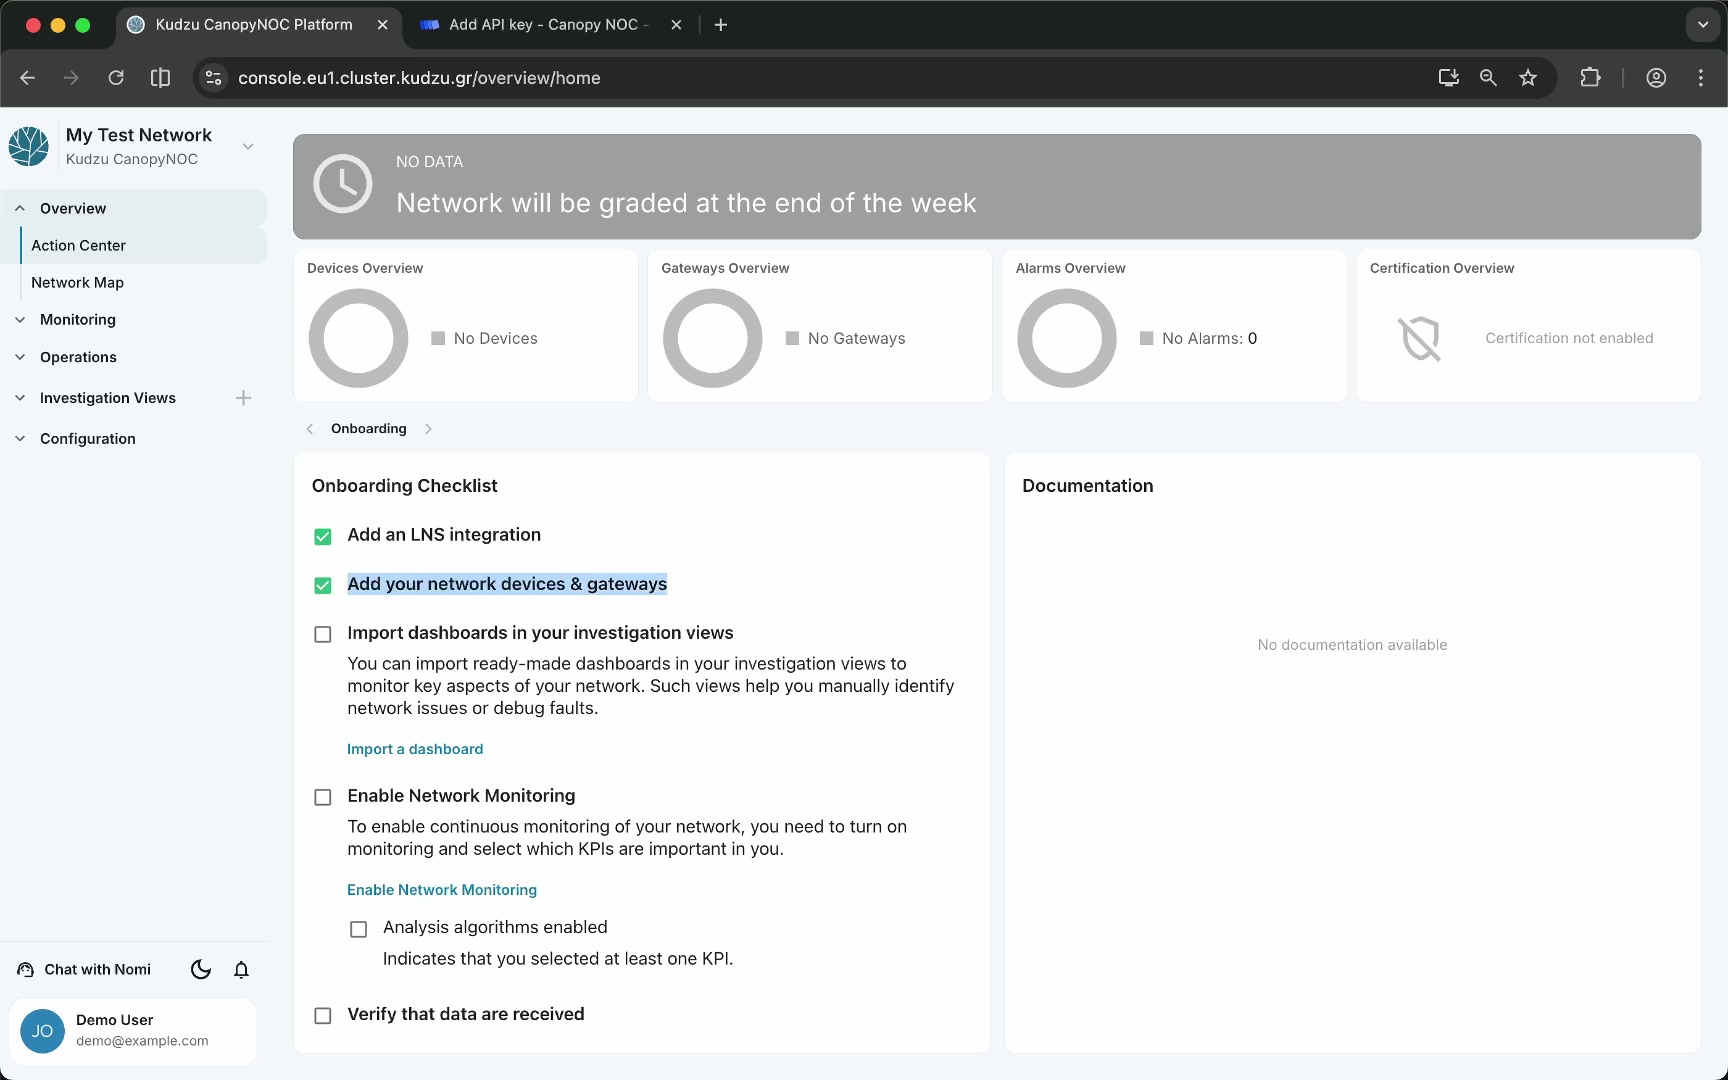
Enabling both Synchronize devices and Synchronize gateways on the LNS integration eliminates the need to manually add devices and gateways in the inventory pages.
7. Import investigation dashboards#
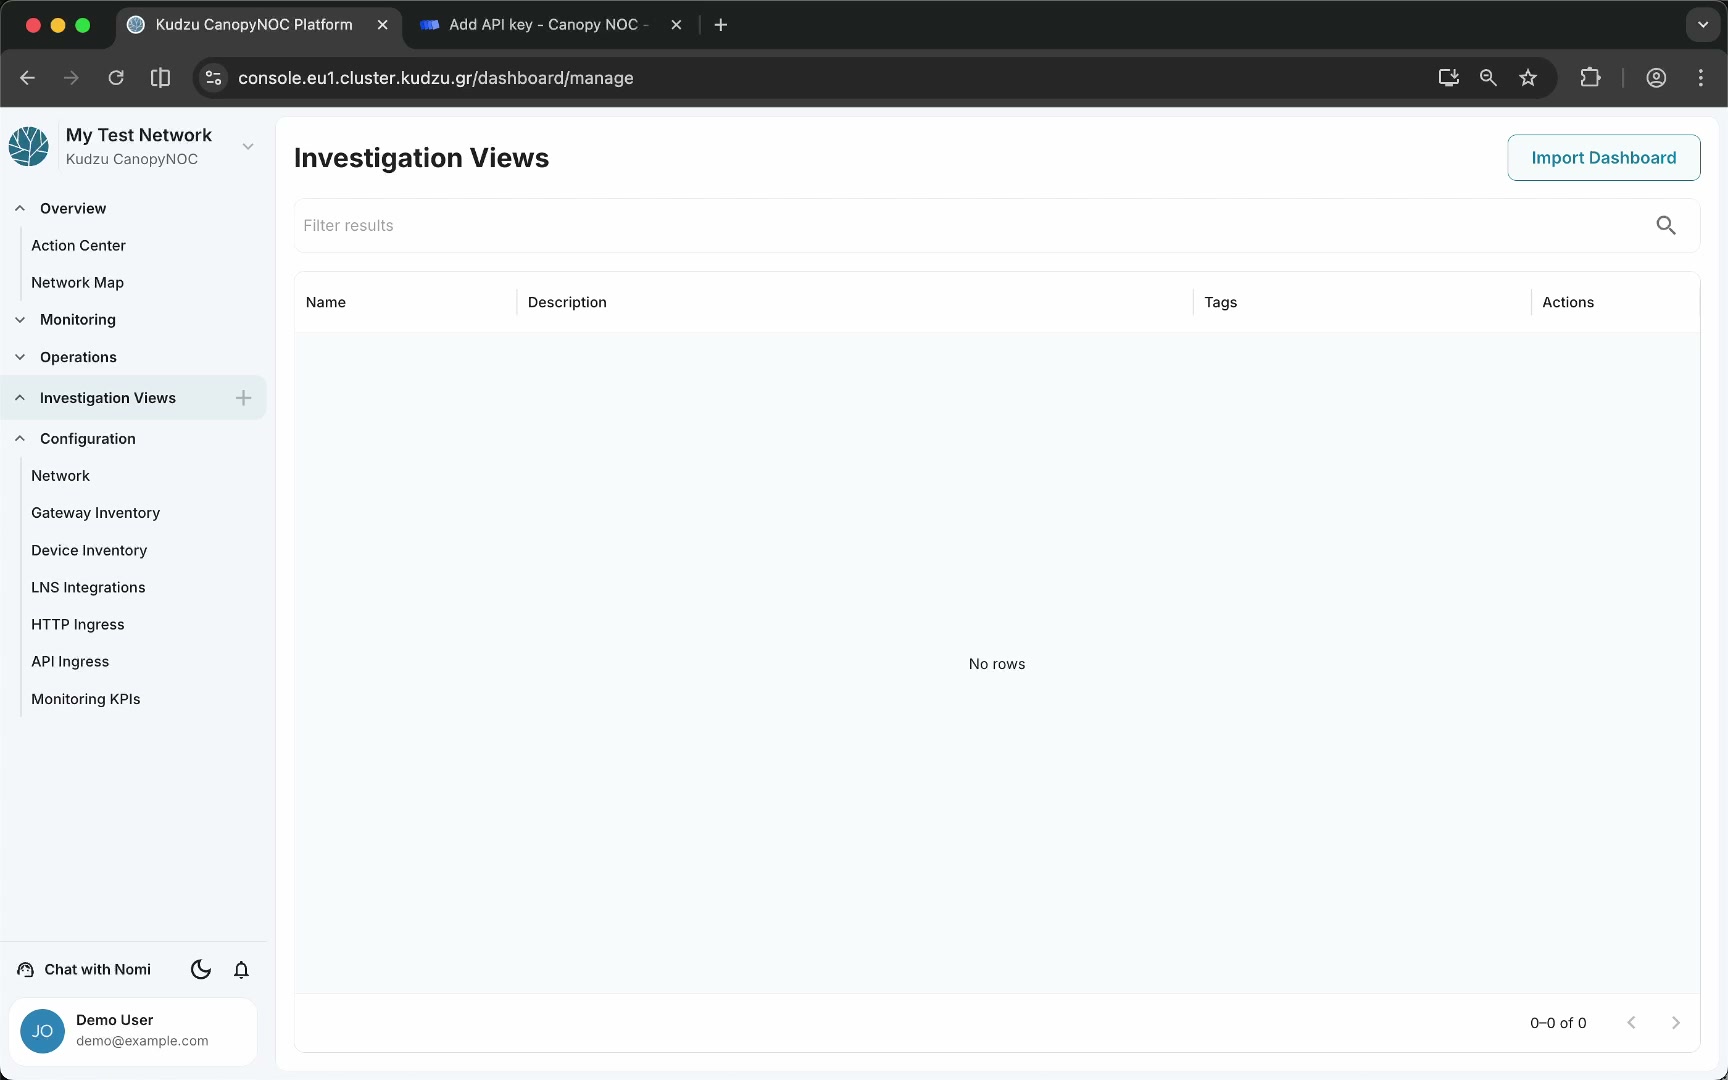
Click Import Dashboards on the onboarding checklist, or navigate to the Investigation Views management page.
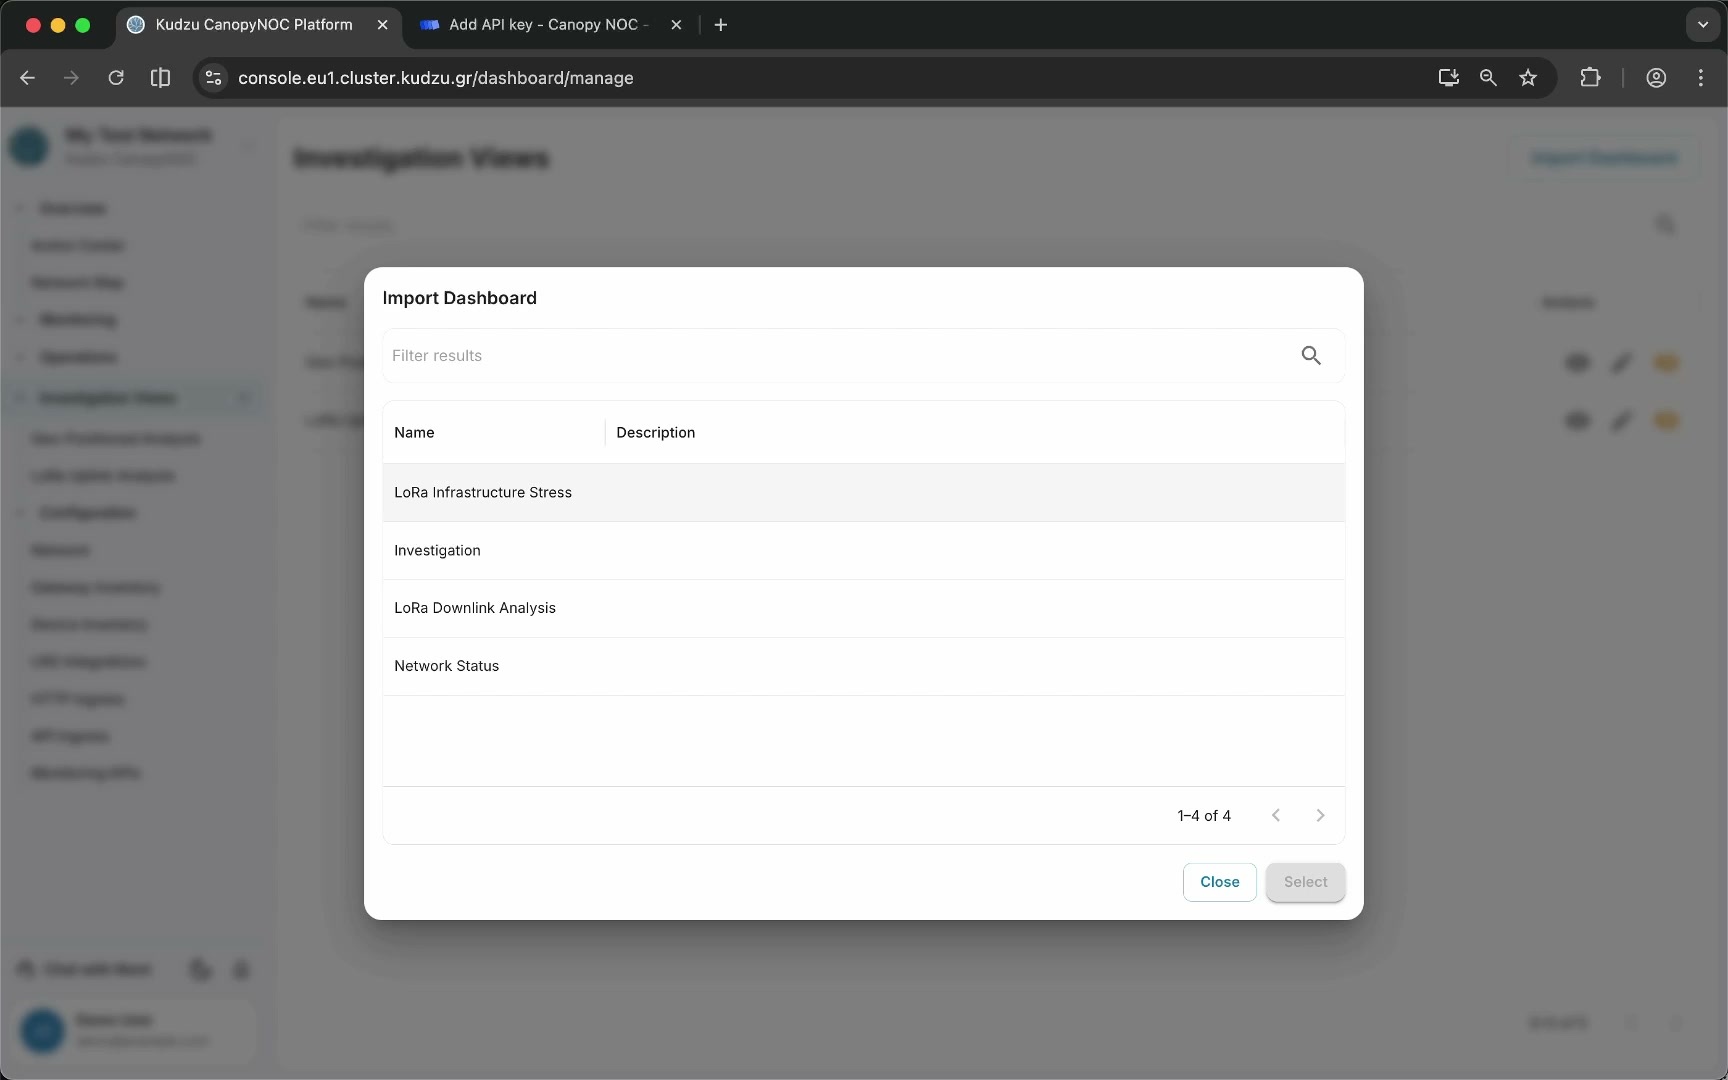
- Click Import Dashboard in the top-right corner.
- Select the dashboards you want. Recommended starting set:
- Geo-Positioned Analysis — map-based traffic and signal quality visualization.
- LoRa Uplink Analysis — uplink signal strength, frequency, spreading factor, and duty cycle metrics.
- LoRa Infrastructure Stress — infrastructure load heatmaps, exposure risk, and join patterns.
- Confirm the selection.
The dashboards appear in the sidebar under Investigation Views. Charts are initially empty and will populate as data arrives.
8. Verify dashboard import on the checklist#
Navigate back to the Action Center. The checklist item Import dashboards in your investigation views is now checked.

9. Enable network monitoring#
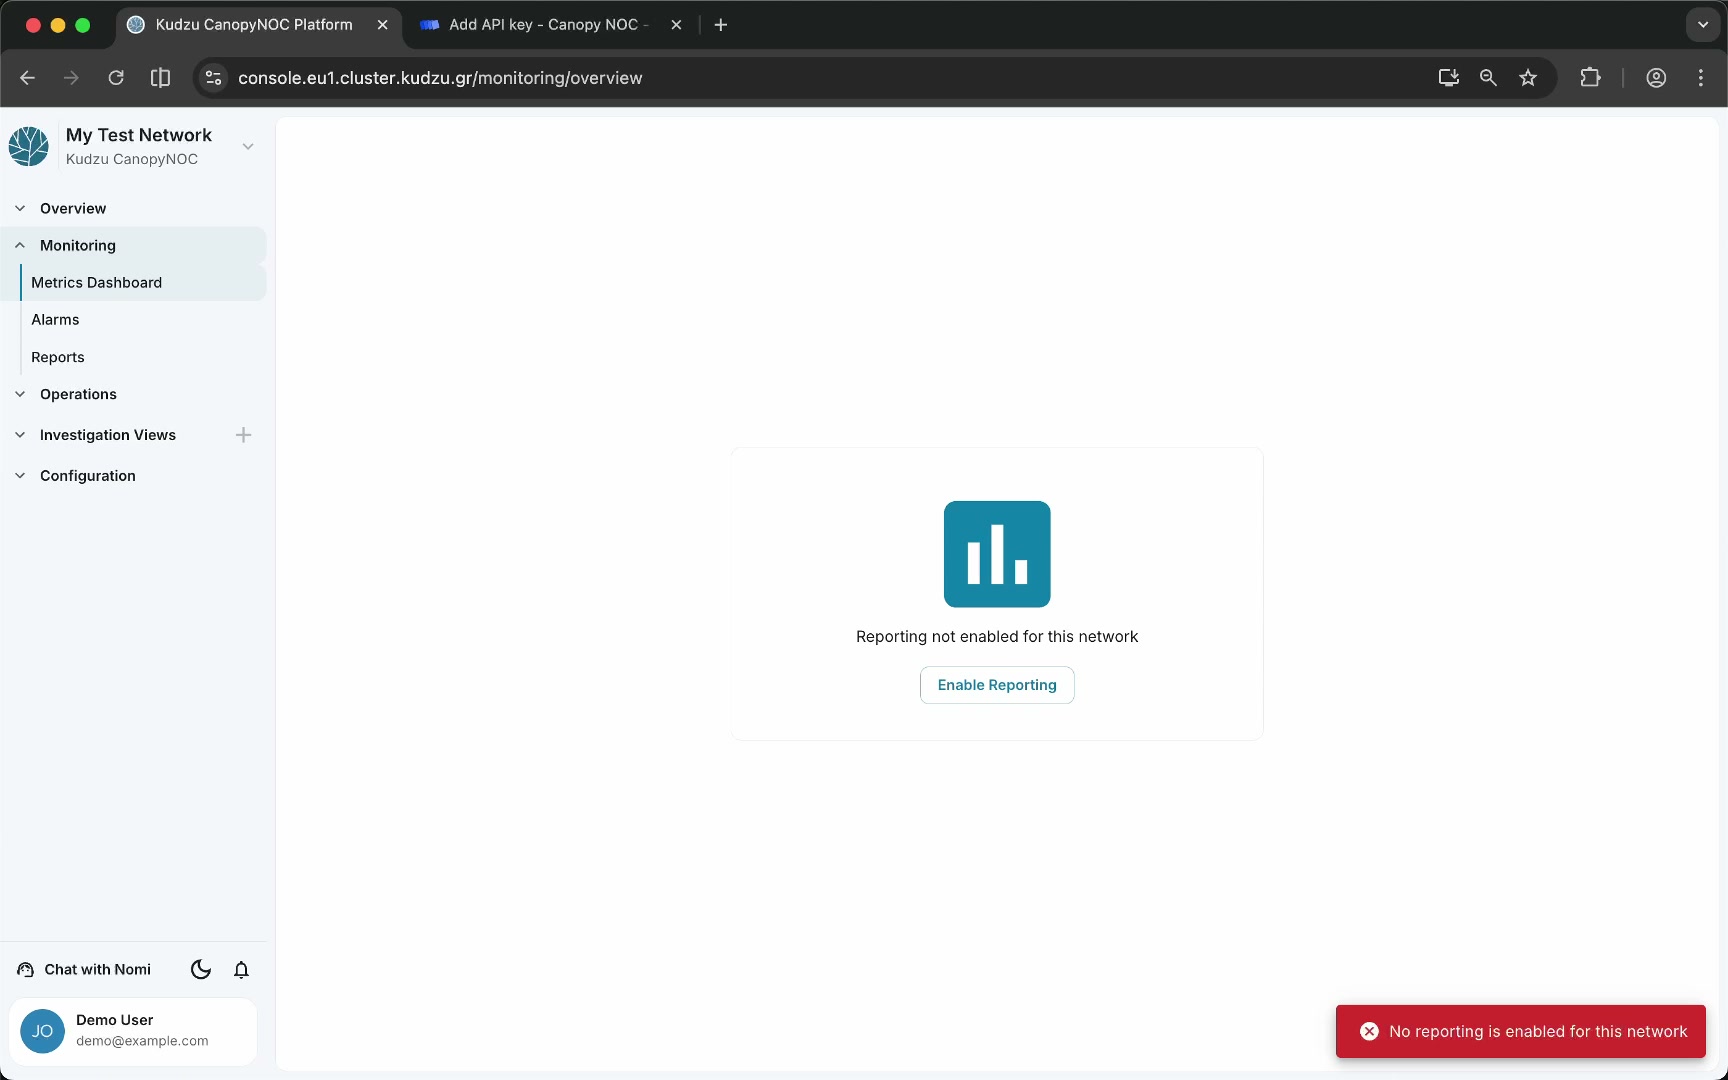
Click Enable Network Monitoring on the onboarding checklist. This navigates to the Metrics Dashboard.
- The dashboard displays the message “Reporting is not enabled on this network.” Click Enable Reporting.
- Reporting is now active, but no KPIs are configured yet. Click the settings icon (gear) next to the search bar, or navigate to Configuration > Monitoring KPIs.
- On the Monitoring KPIs page, click Import Analysis.
- Select one or more analysis algorithms to track on your network.
- Confirm the selection.
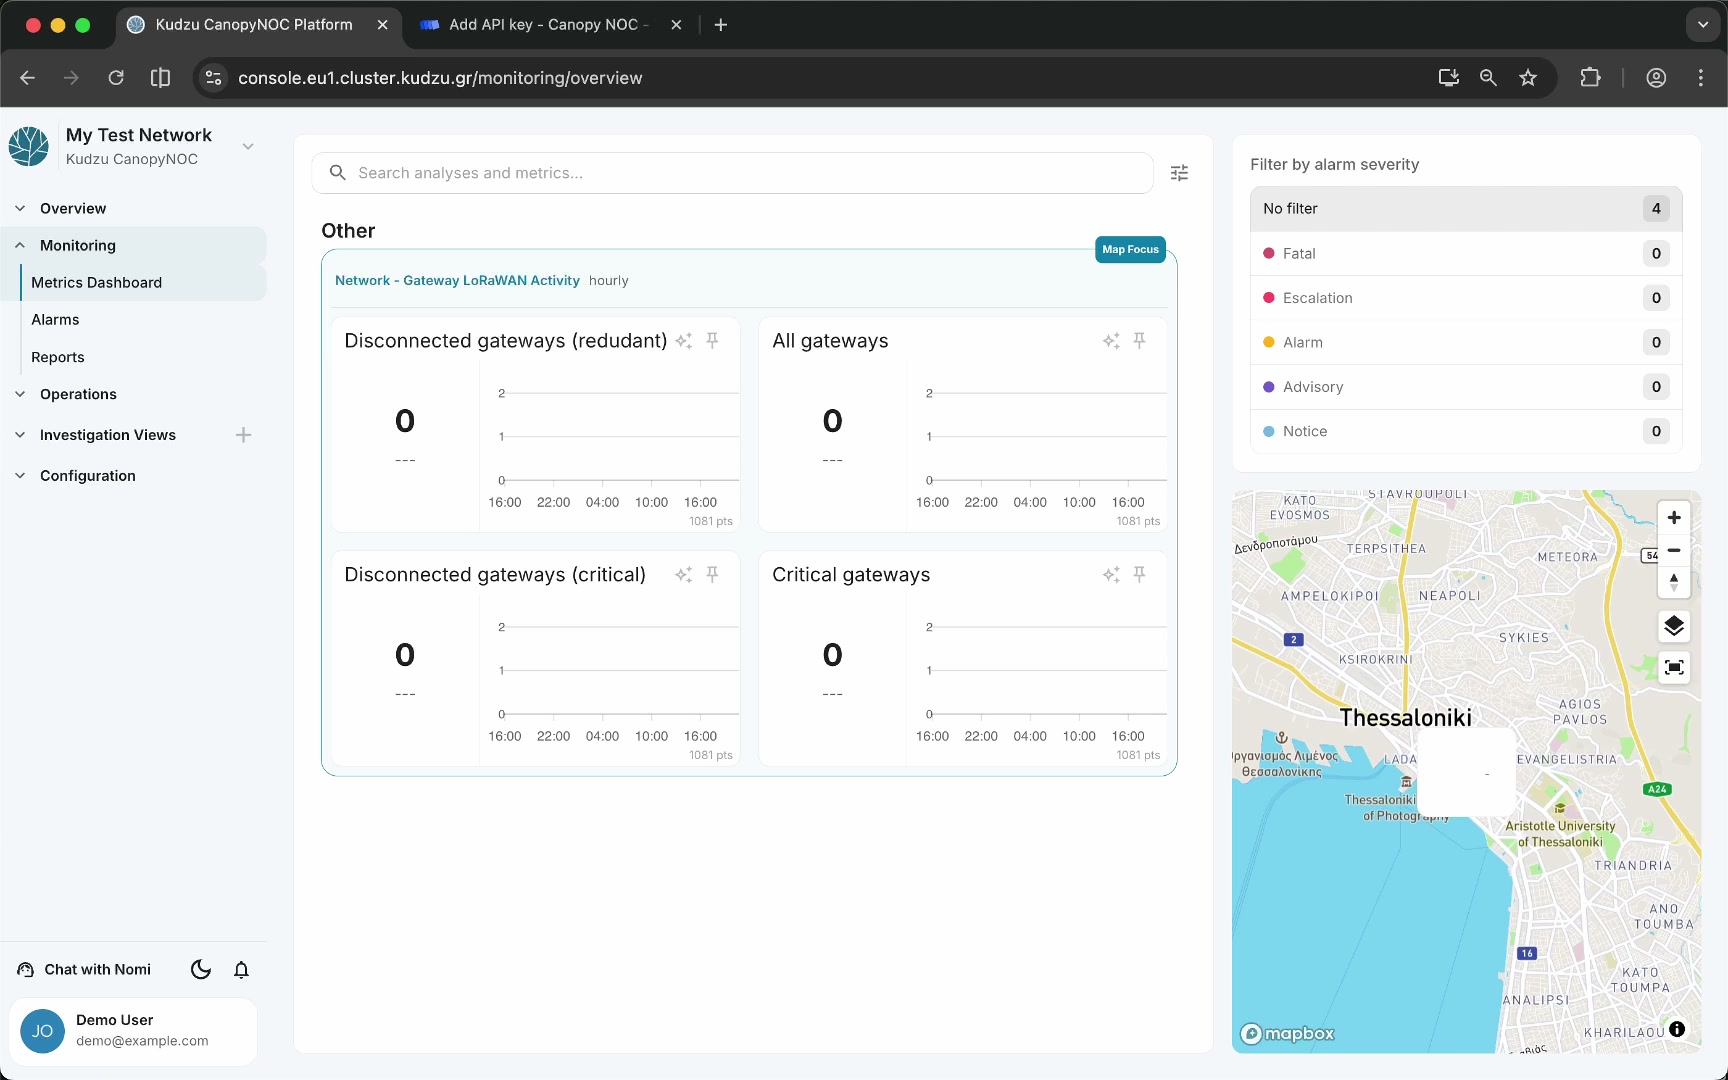
Return to the Metrics Dashboard. The imported metrics now appear as KPI cards. These are the key performance indicators that the platform will continuously monitor.
10. Verify monitoring on the checklist#
Navigate back to the Action Center. The checklist item Enable network monitoring is now checked.
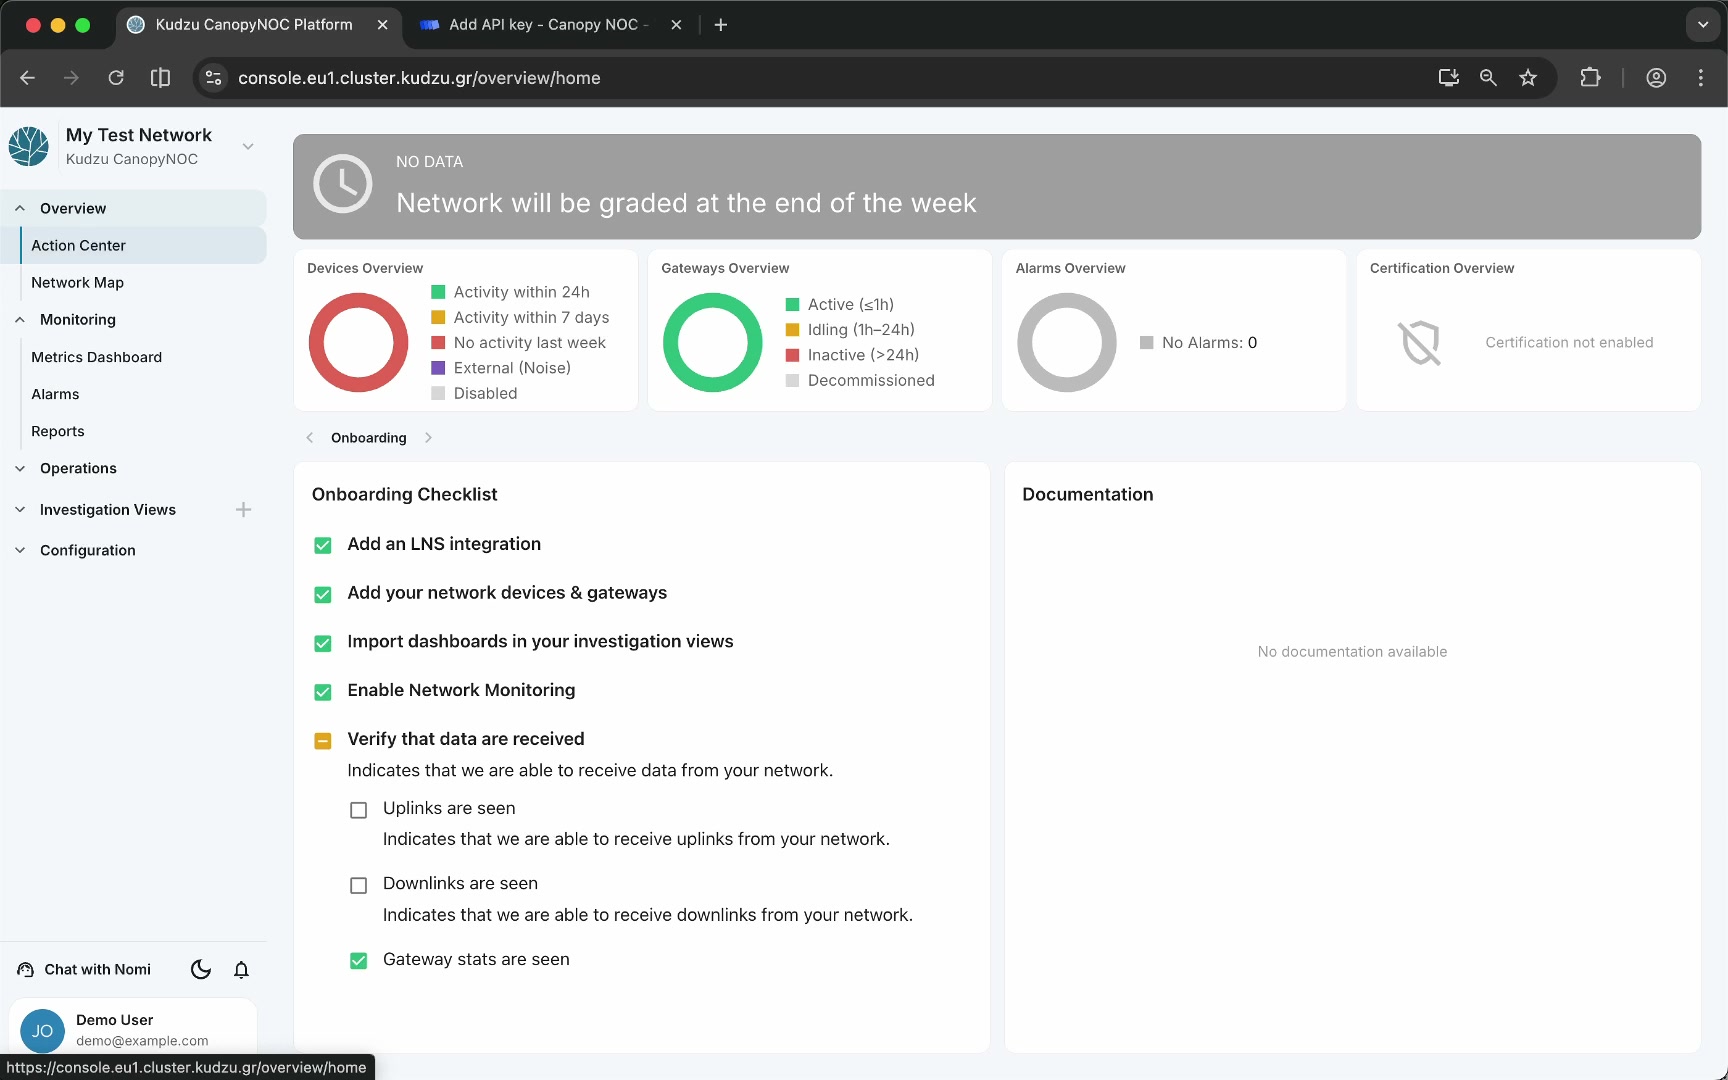
11. Wait for data#
The remaining checklist item requires the platform to receive and process initial network data. This happens automatically once the LNS integration is active and devices and gateways are transmitting. Allow a few hours for sufficient data to arrive and for the first analysis runs to complete.
Once data has been processed, the final checklist item is checked and the Action Center transitions from the onboarding view to the normal operational view — showing network status, overview widgets, and AI-generated optimization suggestions.
The network status banner and overview widgets remain grayed out until the platform has enough data to compute an initial network grade, typically at the end of the first week.
What to do next#
- Explore the Action Center to review optimization suggestions.
- Open your Investigation Views to analyze network traffic.
- Review the Metrics Dashboard to track KPI trends.
- To connect additional data sources or use a different integration method, see Connect Data Ingestion.